I am plotting three surfaces on a 3D plot. They differ in the value of one parameter. Is there a way to distinguish each surface for various values of the parameter?
My code is:
Plot3D[{
2*(Cosh[ h/ T]*(2 + Exp[2 / T]) + Exp[-2 / T]*Cosh[3 h/ T] ),
2*(Cosh[ h/ T]*(2 + Exp[2 10/ T]) + Exp[-2 10/ T]*Cosh[3 h/ T] ),
2*(Cosh[ h/ T]*(2 + Exp[2 100/ T]) + Exp[-2 100/ T]*Cosh[3 h/ T] )},
{T, 0.001, 1000},
{h, 0, 1},
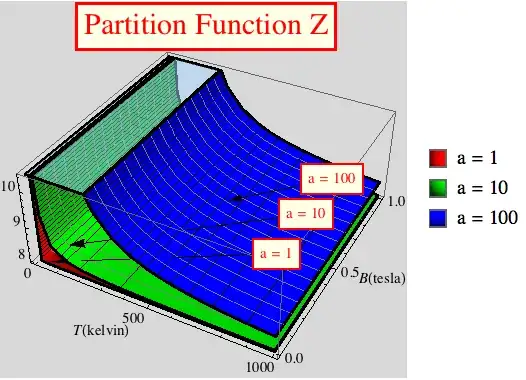
PlotLabel -> Style[Framed["Partition Function Z"], 20, Red,
Background -> Lighter[LightYellow]],
Background -> LightGray,
ColorFunction -> "BlueGreenYellow",
AxesLabel -> {T[kelvin], B[tesla]},
BoundaryStyle -> Thick,
ClippingStyle -> Opacity[0.5]]
The output graphics is:

EDIT
I am trying to use ShowLegend because PlotLegend cannot work with Plot3D in v8...
The code I am using is:
Z[T_, h_, a_] := 2*(Cosh[h/T]*(2 + Exp[2 a/(T)]) + Exp[-2/(T)]*Cosh[3 h/T]);
params = {1, 10, 100};
ShowLegend[
  Plot3D[
    Evaluate[Table[Tooltip[Z[T, h, a], StringForm["a = ``", a]], {a, params}]],
    {T, 0.001, 1000},
    {h, 0, 1},
    PlotLabel -> Style[Framed["Partition Function Z"], 20, Red,
      Background -> Lighter[LightYellow]],
    MeshFunctions -> {(*#1&,*)#2 &, #3 &},
    Mesh -> {(*15,*)15, Range[7.5, 11, 0.1]},
    MeshStyle -> {(*Gray,*)Gray, Black}, Background -> LightGray,
    PlotStyle -> {Red, Green, Blue},
    (*PlotLegends->Table[StringForm["a = ``",a],{a,params}],*)
    AxesLabel -> {T[kelvin], B[tesla]},
    BoundaryStyle -> Thick,
    ClippingStyle -> Opacity[0.5]],
  Graphics3D[{
    Table[{Arrowheads[0.0004],
      Arrow[{{900, 0.2 + 0.25 Log10[a], 9.5},
        {50. + 5 a, 0.01 + 0.005 a, Z[50. + 5 a, 0.01 + 0.005 a, a]}}],
      Text[Style[Framed[StringForm["J = ``", a]], Red, Background -> Lighter[LightYellow]],
        {900, 0.2 + 0.25 Log10[a], 9.5}]},
      {a, params}]}],
  {{{Graphics[{Table[StringForm["a = ``", a], {a, params}]}]}},
    LegendPosition -> {1.1, -.4}}]


PlotStyle -> {Red, Blue}". You'll want to provide three colours, get rid ofColorFunction, and useLighting -> "Neutral". – Dec 26 '12 at 11:39ColorFunctionfor each; then useShowto combine the three images. – Mark McClure Dec 26 '12 at 12:27Plot3DandGraphics3DinShow[..]so that it is a single argument -- or you might drop the arrows if you're going to use a legend. Then the second argument should be something like{Table[{Graphics[{{Red, Green, Blue}[[1 + Log10[a]]], Rectangle[]}], StringForm["J = ``", a]}, {a, params}], LegendPosition -> {1.1, -.4}}. See belisarius's edit for another way, which preserves 3d interactivity. – Michael E2 Dec 27 '12 at 16:42