If I want to draw a line on a Plot I can use Prolog or Epilog. However, this goes wrong if the scale of the plot is small. Here is a minimum working example.
Plot[Sin[x], {x, 0, 3 π}, Frame -> True,
 Prolog -> {Red, Line[{{4, -1}, {4, 1}}]}]
Plot[10^-13 Sin[x], {x, 0, 3 π}, Frame -> True,
 Prolog -> {Red, Line[{{4, -1}, {4, 1}}]}]


No vertical line is drawn in the second case. This is the problem. I guess that it is due to the small scale and the line is not drawn to this resolution. If I change the scale of the vertical line it works
Plot[10^-13 Sin[x], {x, 0, 3 π}, Frame -> True,
 Prolog -> {Red, Line[{{4, -10^-13}, {4, 10^-13}}]}]
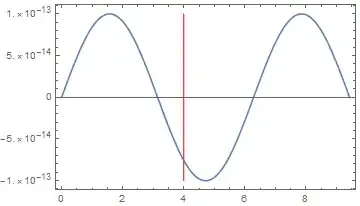
However this requires me to find the scale of the plot first and put this into the line. I am working with the strains from the Finite Element Method within a Dynamic and I can't predict the scale in advance. I thought of this
Show[Plot[10^-13 Sin[x], {x, 0, 3 π}, Frame -> True],
 Graphics[{Red, Line[{{4, -1}, {4, 1}}]}]
 ]
However this does not work either. Is it possible to use Scaled or Offset? I failed when I tried. Thanks for suggestions.

Scaledthis is a good example to learn.InfiniteLineis more intuitive. All good and helpful, thanks. – Hugh Mar 28 '18 at 09:44