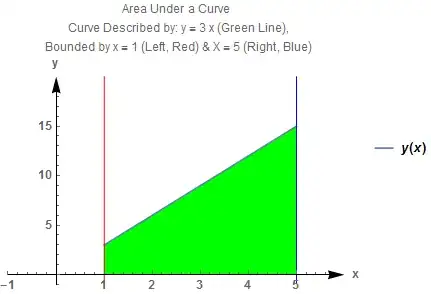
Grandson & I are once again using Mathematica to demonstrate some of his calculus. He's on definite integrals now. His problem asked him to determine the area under the curve for y = 3 x, bounded by x = 1 & x = 5. We easily solved the problem using Integrate but he asked what this looked like when plotted. I first showed him on paper..., no, that wasn't enough, "How do we do this in MM?, he asked. (We came up with a solution which I'll provide as an answer below but obviously, welcome other thoughts, improvements, etc.)
Asked
Active
Viewed 296 times
1 Answers
4
Here's our solution:
y[x_]:=3 x
xNegPlotRange = -1; xPosPlotRange = 6; yNegPlotRange = -1; \
yPosPlotRange = 20;
strPlotLabel1 = "Area Under a Curve
  Curve Described by: y = 3 x (Green Line),
  Bounded by x = 1 (Left, Red) & X = 5 (Right, Blue)";
p1 = Plot[y[x], {x, 1, 5}, Axes -> True, Filling -> Axis,
   FillingStyle -> Green, Frame -> False, AxesLabel -> {"x", "y"},
   PlotLabel -> strPlotLabel1,
   AxesStyle -> Directive[Bold, Medium, Arrowheads[{0, 0.05}]],
   PlotLegends -> "AllExpressions",
   PlotRange -> {{xNegPlotRange, xPosPlotRange}, {yNegPlotRange,
      yPosPlotRange}}];
p2 = Plot[100 Sign[x - 1], {x, -10, 10}, ExclusionsStyle -> Red,
   PlotRange -> {-10, 20}];
p3 = Plot[100 Sign[x - 5], {x, -10, 10}, ExclusionsStyle -> Blue,
   PlotRange -> {-10, 20}];
Show[p1, p2, p3,
 PlotRange -> {{xNegPlotRange, xPosPlotRange}, {yNegPlotRange,
    yPosPlotRange}}]
Suggestions?