I am running Mathematica 7. Suppose that I plot $\sin(x)$ for $x = 0..10$ and frame the plot using Frame -> True:
Plot[Sin[x], {x, 0, 10}, PlotRange -> All, Frame -> True]
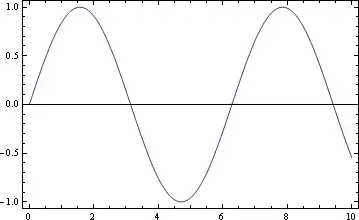
Now suppose that I would like the horizontal axis to have ticks every $0.5$ (which it does), but with the ticks labeled only every $1$. Is there a way to do this?
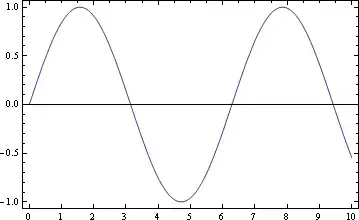
FrameTicks seemed to be a possibility, but when I used Range[0, 10, 1] in the bottom horizontal axis specification, I lost the (non-labeled) ticks at every $0.5$:
Plot[Sin[x], {x, 0, 10}, PlotRange -> All, Frame -> True,
 FrameTicks -> {{Automatic, Automatic}, {Range[0, 10, 1], Automatic}}]
Thanks for your time.
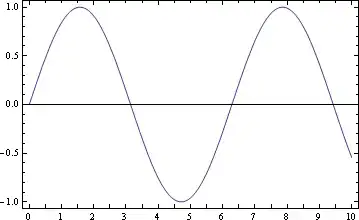
FrameTicks -> {{Automatic, Automatic}, {Join[Range[0, 10], Thread[{Range[0.5, 10, 1.], " "}]], Automatic}}]work? – kglr Jan 14 '13 at 22:37CustomTicks. I think you'd end up rewriting the same thing anyway. It saves times to just use CustomTicks and you'll get a prettier output with less work. – Szabolcs Jan 14 '13 at 23:30