4

I have one more problem, still with exporting full quality 3d figure into Word. I want perfect quality in a Word document of a 3d figure prepared with legend (traditional form of text). Extremes of the function in figure is nice to be yellow and rest of the function feature red.

Example,

  Plot3D[Sin[4 x]*Cos[4 y], {x, -2, 2}, {y, -2, 2}]

I need this figure to import in Word with full prepared legend and combination of color (red-yellow).

VividD
  • 3,660
  • 4
  • 26
  • 42
Pipe
  • 1,099
  • 8
  • 18
  • I can't figure out what exactly the question is. What is the link supposed to tell us? – Jens Jan 15 '13 at 19:19
  • This appears to cover exactly the same ground as your previous question at http://mathematica.stackexchange.com/questions/17706/what-is-the-best-way-to-make-a-plot-complete-with-legends-so-it-is-exported-rea – whuber Jan 15 '13 at 19:54
  • @Jens I think he wants the graphics like this question. Or he wants to employ you as private consultant... :) – cormullion Jan 15 '13 at 19:56
  • @Jens question is how to prepare figure for word in best quality. link is just about coloring (red-yellow combination of the 3d function), I need in extreme region yellow and other part of the graphic red. – Pipe Jan 15 '13 at 20:01
  • Sorry, I don't have word so I don't feel qualified to answer this, because I cannot define "best quality". – Jens Jan 15 '13 at 20:33
  • @Jens, it is changed, not best quality, vector quality as in case of 2D – Pipe Jan 15 '13 at 21:20
  • @Jens is it more clear, I edited the question, sorry if I made some mistake. Can you mark some links with already prepared answers of similar question? – Pipe Jan 15 '13 at 21:22
  • How is this different from your previous question? That whuber linked to? Does the answer there not work for 3D? – rm -rf Jan 15 '13 at 21:37
  • @rm -rf linked that I posted and whuber repeated is just to show combination of colors which I want to use, I know that it is simple, but exporting in good quality is a problem, I need similar answer with this http://mathematica.stackexchange.com/questions/17706/what-is-the-best-way-to-make-a-plot-complete-with-legends-so-it-is-exported-read – Pipe Jan 15 '13 at 22:04
  • @Jens, rm, whuber is the question now more clear, i will simplify, don't hesitate for asking to explain which part of the question is not clear – Pipe Jan 15 '13 at 22:06

1 Answers1

4

Here is what I can say: to make a 3d plot with the color scheme you want and then give it a label, you can in fact rely on another answer I posted to the question "ShowLegend values". The steps are as follows:

  1. From the linked answer, copy the second code block (below the heading Color bar legend) defining the functions trimPoint, all the way down to display, and execute them in your notebook. These definitions are used to arrange information about a plot as a legend.

  2. Now we'll make your example plot with some nice colors.

Here I've chosen the SunsetColors scheme from the Palettes > Color Schemes menu. You could make your own scheme using Blend.

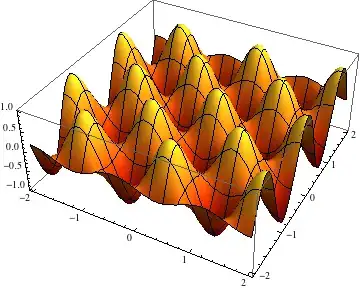
plot = Plot3D[Sin[4 x]*Cos[4 y], {x, -2, 2}, {y, -2, 2}, 
  ColorFunction -> "SolarColors"]

plot3D

  1. Next, make the labeled plot.

The information we need for the label is the range of z values to which the colors correspond, and the color function. The other numbers are relative dimensions of the plot versus label:

With[{
  range = {-1, 1},
  plotWidth = .8,
  labelHeight = .5,
  labelWidth = .15
  },
 display[{
   plot // at[{0, 0}, plotWidth], 
   colorLegend[ColorData["SolarColors"], range, Contours -> 8] // 
    at[{0.85, .1}, Scaled[{labelWidth, labelHeight}]]}, 
  AspectRatio -> .75]
 ]

label

The commands display and at are explained in the answer linked above. The rest is to export this plot as a suitable image (I guess). That would be

Export["image.png",%]

An alternative to using my display function for the legend is to hand-craft your own legend using the general approaches in the answers to "Spreading colors in ListDensityPlot". The reason I wrote my solution was so the legending process can be automated more. In my earlier answer, I had also defined a function reportColorRange that can automatically keep track of the range of colors and function values, but it only works for 2D plots because the ColorFunction option in 3D takes additional arguments that I didn't make any provisions for.

Jens
  • 97,245
  • 7
  • 213
  • 499