Under the options menu for Histogram, there is an option called ChartLegends, which adds little boxes beside the plot to indicate which curve represents what. I cannot find a similar option for SmoothHistogram. I know that PlotLegends is new in version 9, and I would've expected the option to be valid for SmoothHistogram as well. Does anybody know of a way around this issue?
Asked
Active
Viewed 756 times
6
cartonn
- 1,005
- 6
- 15
1 Answers
13
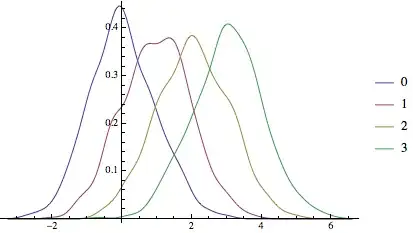
Even though the documentation for SmoothHistogram doesn't explicitly mention PlotLegends as an option, it is a valid option and works as expected:
SmoothHistogram[
 Table[RandomVariate[NormalDistribution[c, 1], 500], {c, 0, 3}],
 PlotLegends -> {"0", "1", "2", "3"}]
In general, it's a good idea to try out options that you think should work (for functions where it makes sense), but is missing in the documentation. More often, it's the case that the documentation is either lacking or the option was left out to make room for other more important ones.
You should also check if these options were defined for the function and disabled by default, which happens to be the case with SmoothHistogram:
Options[SmoothHistogram, PlotLegends]
(* PlotLegends -> None *)
rm -rf
- 88,781
- 21
- 293
- 472
None. – Mr.Wizard Jan 16 '13 at 08:49