I want to set color to a rectangle (in fact a line) that lies on (0,0) and (1,0), and the color function is given by $u(x,t)=t(x-x^2), 0\leq t\leq1$. Since, this $u(x,t)$ act as temperature at the point $(x,0)$ at time $t$, I want to use the colordata with "TemperatureMap", the following is what I have tried:
u[x_, t_] := t (x - x^2)
Animate[Plot[0, {x, 0, 1},
 AxesOrigin -> {0, 0},
 PlotRange -> {{0, 1}, {-0.02, 0.25}},
 PlotStyle -> {Thick},
 ColorFunction -> (ColorData["TemperatureMap"][u[#, t]]) &],
{t, 0, 1}]
I find that it must be some problem in the ColorFunction, but I can't fix it, any suggestion?
I have tried your code, and find it shall works as the first answer, but since my original question (not posted here) is tried to solving the following question,
f[x_] := -x^2 + x
equ = {D[u[t, x], t] == D[u[t, x], x, x],
u[0, x] == f[x],
u[t, 0] == f[0],
u[t, 1] == f[1]};
sol = NDSolve[equ, u, {t, 0, 1}, {x, 0, 1}]
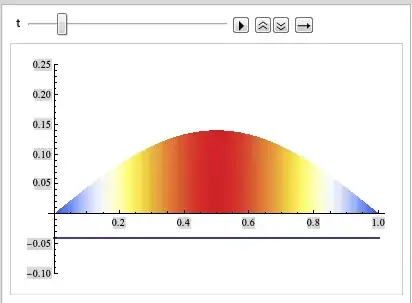
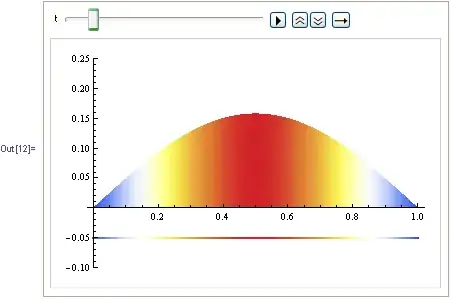
HeatConda = Animate[Show[{
Plot[Evaluate[u[t, x] /. sol], {x, 0, 1},
PlotRange -> {-0.1, 0.25}, AxesOrigin -> {0, 0},
Filling -> Axis,
ColorFunction -> (ColorData["TemperatureMap"][#2] &)],
Plot[-0.04, {x, 0, 1}, PlotStyle -> {Thick},
ColorFunction ->
Function[{x, y},
ColorData["TemperatureMap"][Evaluate[u[t, x] /. sol]]]]}],
{t, 0, 0.4}]
I want to color the bottom line as the same as the filling color. I first tried to simplify the question to the one post here, but the solution here still can work for my (original) question, so please help me again?
ColorFunctionoption help. It usually normalizes its output, however in this particular case I did it myself. – Dr. belisarius Jan 18 '13 at 15:55