There are two methods: Labeled or Callout, as follows:
ListPlot[{Labeled[{94, 1}, "lisbon"], Labeled[{89, 87}, "antwerp"],
  Labeled[{7, 33}, "boston"], Labeled[{30, 26}, "edinburgh"],
  Labeled[{32, 60}, "lima"]}]

ListPlot[{Callout[{94, 1}, "lisbon"], Callout[{89, 87}, "antwerp"],
  Callout[{7, 33}, "boston"], Callout[{30, 26}, "edinburgh"],
  Callout[{32, 60}, "lima"]}]
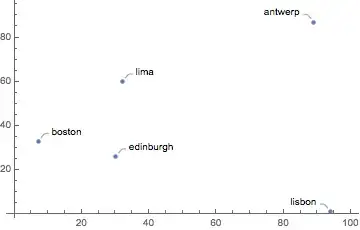
As you can see, the primary difference is the addition of callout lines. It should be noted, an avoidance algorithm is used and can result in some of the labels not being displayed as they're converted to Tooltips, e.g.
count = 100;
points = RandomInteger[{0, 100}, {count, 2}];
labels = "label " <> ToString[#] & /@ Range[count];
ListPlot[MapThread[Labeled, {points, labels}]]
ListPlot[MapThread[Callout, {points, labels}]]