Simply like this:
map = Graphics[{GrayLevel[0.2], AbsoluteThickness[1.5],
CountryData[
"World", {"SchematicPolygon", {"Equirectangular", {0,
180}}}] /. Polygon -> Line}, Frame -> True];
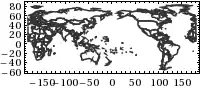
Show[map,
FrameTicks -> {{Automatic,
None}, {Transpose[{Range[13]*30 - 210, Range[13]*30 - 30}],
None}}, ImageSize -> 400]

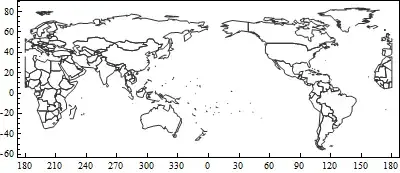
Show[map,
 FrameTicks -> {{Automatic,
    None}, {Transpose[{Range[13]*30 - 210,
      RotateLeft[Range[13]*30 - 30, 7] /. x_ /; x > 180 :> x - 30}],
    None}}, ImageSize -> 400]
Addendum
In answer to comment:-
map = Graphics[{GrayLevel[0.2], AbsoluteThickness[1.5],
    CountryData[
      "World", {"SchematicPolygon", {"Equirectangular", {0,
         180}}}] /. Polygon -> Line}, Frame -> True];

linepos = First[Position[map, Line]];
line = Extract[map, Most[linepos]];
newline = line /. {a_Real, b_} :> {a + 180, b};
map2 = ReplacePart[map, Most[linepos] -> newline];

p2 = ListContourPlot[
   Table[Sin[i + j^2], {i, 0, 3, 0.1}, {j, 0, 3, 0.1}],
   Contours -> 15, ColorFunction -> "Rainbow", AspectRatio -> 1/2,
   DataRange -> {{0, 360}, {-90, 90}}];

Show[p2, map2, ImageSize -> 400]