I have several data files which contain columns of data. All my files follow the same format data001.out, data002.out, ... , data00n.out. I want to import and plot all of them simultaneously. In particular, I use only the first two columns of the data files for my plot. I wrote this simple Mathematica code:
SetDirectory["..."];
dataAll = {};
Do[
data = ReadList["data00" <> ToString[NumberForm[i, 2, NumberPadding
-> {"0", ""}]] <> ".out", Number,
RecordLists -> True];
pdata = Table[{data[[j, 1]], data[[j, 2]]}, {j, 1, Length[data]}];
AppendTo[dataAll, Flatten[pdata]];
, {i, 1, 50}
]
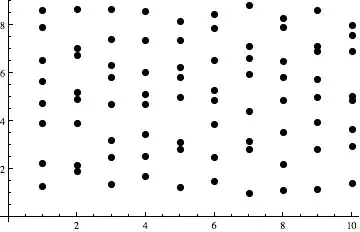
S0 = ListPlot[dataAll, Frame -> True, FrameLabel -> {"x", "y"},
RotateLabel -> False, PlotStyle -> {Black, PointSize[0.01]},
PlotRange -> All, ImageSize -> 500]
I am wondering, if there is a simpler or even more correct way to perform this task. Perhaps, the Do loop needs improvement.
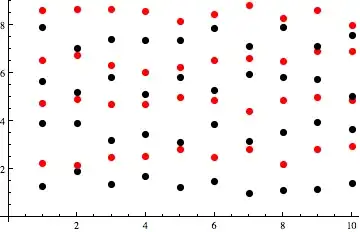
I noticed that the PlotStyle in ListPlot does not apply to all points of the dataAll list. Even if I determine the color (black) and the size, the output contains several colors ans sizes. Where is the mistake?
Many thanks in advance!

PlotStyleremains unsolved. – Vaggelis_Z Jan 22 '13 at 17:27data*.outfiles that reside on your disk and we have no way of knowing what's in them and what the issues with your plot are. Please include a minimal example that users can copy-paste-evaluate to see your problem. Use simple functions likeSin[x]orRandomRealif a random list would suffice. – rm -rf Jan 22 '13 at 17:33PlotStyle -> {{Black, PointSize[0.01]}}. Note the extra {} brackets. Without those, Mathematica cycles between black and automatically chosen colors with the size defined byPointSize. – VLC Jan 22 '13 at 17:38IntegerStringoverToStringandNumberForm."data" <> IntegerString[i, 10, 3] <> ".out",is simpler. – m_goldberg Jan 22 '13 at 18:02