I am trying to do a density plot of a function in polar coordinates.
The function I am interested in study is
$\Lambda^4 (1 - Cos(\frac{r[t]}{f_r} - \frac{\theta[t]}{f_{\theta}})) +
\frac{1}{2} m^2 r[t]^2$
but I don't know how to plot that onto a plane ($r[t]Cos(\theta[t])$, $r[t]Sin(\theta[t])$).
the parameters can be $ f_r = 10^{-3}, f_{\theta} = 10^{-1}, m = 10^{-4}, \Lambda = 10^{-3} $
Any suggestions?

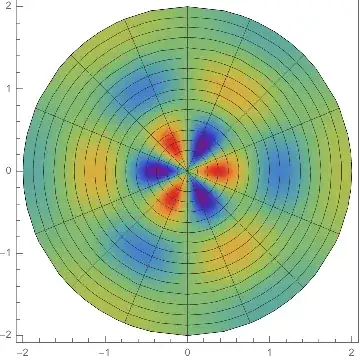
ViewPointinfinitely above:ParametricPlot3D[{r Cos[t], r Sin[t], f[r, t]}, {r, 0, R}, {t, 0, 2 Pi}, ColorFunction -> "Rainbow", ViewPoint -> {0, 0, Infinity}]– Michael E2 Oct 08 '18 at 14:10