3

I have a list of dates that happen throughout 2013. I wish to construct a graph showing a cumulative total of elements that happen before that date.

I have a working algorithm, but it seems too slow and inefficient.

Let's generate some random dates:

dates = {2013, #[[1]], #[[2]]} & /@ Transpose@{RandomInteger[{1, 12}, {100}], 
    RandomInteger[{1, 30}, {100}]};

Define a function that calculates the totals:

datecounts[dates_, effectivedate_, spanindays_] := Module[{range, compares},
  range = DateRange[effectivedate, DatePlus[effectivedate, spanindays]];
  compares = Partition[(AbsoluteTime[#[[1]]] > AbsoluteTime[#[[2]]]) & /@ 
     Tuples[{range, dates}], Length[dates]];
  Transpose@{range, Count[#, True] & /@ compares}]

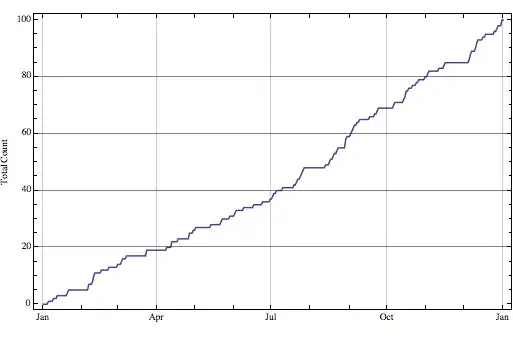
And graph the results:

DateListPlot[datecounts[dates, {2013, 1, 1}, 365], PlotStyle -> {Thickness[0.003]},
   Joined -> True, GridLines -> Automatic, FrameLabel -> {Null, "Total Count"}]

Any help in improving efficiency or better use of functions is greatly appreciated.

enter image description here

kale
  • 10,922
  • 1
  • 32
  • 69

3 Answers3

6

Since you are just looking for counts, I would do the following:

DateListPlot[
 Transpose[{
   AbsoluteTime /@ Sort[#, AbsoluteTime[#1] < AbsoluteTime[#2]& ]& @ dates,
   Range @ Length @ dates
   }],
 PlotStyle -> {Thickness[0.003]}, Joined -> True, 
 GridLines -> Automatic, FrameLabel -> {Null, "Total Count"}, 
 InterpolationOrder -> 0
]

Mathematica graphics

halirutan
  • 112,764
  • 7
  • 263
  • 474
rcollyer
  • 33,976
  • 7
  • 92
  • 191
  • Much faster, but only plots 100 points in this case instead of a point for each day in 2013... Not a bad thing, just haven't thought of it that way. – kale Feb 01 '13 at 04:34
5
newdata =  Transpose[{dates[[Ordering[AbsoluteTime /@ dates]]], Range@Length@dates}];
DateListPlot[newdata, Joined -> True]

enter image description here

 DateListPlot[newdata,Joined -> True, InterpolationOrder -> 0]

enter image description here

Update: Let HistogramList do the counting:

 dts = AbsoluteTime /@ dates;
 (* number of says between the earliest and latest dates - 
   to be used as the number of bins in the second argument of HistogramList*)
 daysbetween = DateDifference[Sequence @@ Through[{Min, Max}[dts]]];
 DateListPlot[Transpose[Delete[
     HistogramList[dts, daysbetween, "CumulativeCount"],
     {1, 1}]],
 Joined -> True, ImageSize -> 500]

enter image description here

Update 2: ... there is also EmpiricalDistribution

  {min, max} = Through[{Min, Max}[dts]]; 
  Plot[CDF[EmpiricalDistribution[dts], x], {x, min, max}]
kglr
  • 394,356
  • 18
  • 477
  • 896
0

You could use that:

plotDates[dates_,dtIni_,years_:1]:=Module[{newDate},
    newDate=Tally[Sort@dates];
    newDate[[All,2]]=Accumulate[newDate[[All,2]]];
    DateListPlot[newDate,Joined->True,PlotStyle->{Thick,Red},InterpolationOrder->0,PlotRange->{{dtIni,DatePlus[dtIni,{years,"Year"}]},All}]
]

I like this ways to accumulate the informations, it's very fast!

The result is something like your have already done.

plotDates[dates,{2013,1,1}]

accumulated plot

If you need the zeros (I regularly need to calculate come averages!), there is a answer that can helps you of a function that I called fillDateGaps.

Murta
  • 26,275
  • 6
  • 76
  • 166