"address to lat/long" is usually called Geocoding, in case that helps with your research. Some options for a Geocoding API include OpenStreetMaps' Nominatim, Google Maps' API, and many others. Beware that virtually every option will either require payment or have a very stringent usage quota.
FindGeoLocation or Interpreter
FindGeoLocation["9 Park St, Boston, MA 02108"]
GeoPosition[{42.3565, -71.062}]
Another official Wolfram Language way to do this is by using Interpreter, like so:
Interpreter["StreetAddress"]["9 Park St, Boston, MA 02108"]
GeoPosition[{42.3565, -71.062}]
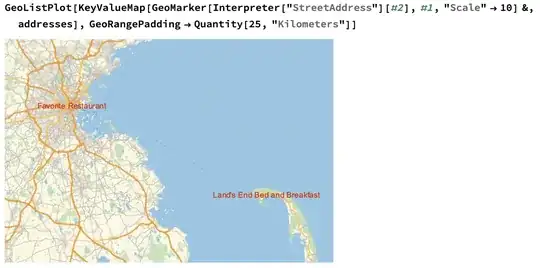
Both of those functions work for the addresses you have, so you can plot them like so:
GeoListPlot[
 KeyValueMap[
  GeoMarker[Interpreter["StreetAddress"][#2], #1] &,
  addresses]]
or
GeoListPlot[
     KeyValueMap[
      GeoMarker[FindGeoLocation[#2], #1] &,
      addresses]]
You can experiment with different marker styling and so on - check the documentation for GeoMarker. Many of the typical Plot labeling functions like Callout aren't supported in GeoGraphics functions, however.
Nominatim
You might consider using Nominatim, in which case you could do it the following way:
First, query the service:
result = Import[
  HTTPRequest[
   "https://nominatim.openstreetmap.org/search", <|
    "Query" -> URLQueryEncode[<|
       "format" -> "xml",
       "q" -> "9 Park St, Boston, MA 02108",
       "limit" -> 1
       |>]|>], "XML"]
Extract the attributes of the first place:
attrs = Association[
  Cases[result, XMLElement["place", attr_, _] -> attr, \[Infinity]]]
Finally, the actual position can be determined:
position = GeoPosition@ToExpression@Values[attrs[[{"lat", "lon"}]]]
Simply do this for each address you have and plot it like above.
We can bundle it into a single function:
geocode[address_] := Module[{result =
    Import[
     HTTPRequest[
      "https://nominatim.openstreetmap.org/search", <|
       "Query" ->
        URLQueryEncode[<|"format" -> "xml", "q" -> address,
          "limit" -> 1|>]|>], "XML"],
   attrs
   },
  attrs =
   Association[
    Cases[result, XMLElement["place", attr_, _] -> attr, \[Infinity]]];
  GeoPosition@ToExpression@Values[attrs[[{"lat", "lon"}]]]
  ]
And now we can do this:
geocode["9 Park St, Boston, MA 02108"]
GeoPosition[{42.3576, -71.0629}]
That's extremely close to the Nominatim result. So close that I bet Wolfram have their own Nominatim deployment for this functionality.
Anyway, since we have this function, we can plot things the same way as if we used Interpreter:
GeoListPlot[KeyValueMap[GeoMarker[geocode[#2], #1] &, addresses]]

As I said above: You can experiment with different marker styling and so on - check the documentation for GeoMarker. Many of the typical Plot labeling functions like Callout aren't supported in GeoGraphics functions, however.


