I have a list of positions as a function of time data and want to apply the Savitzky–Golay method to find the first derivative. What is the approach I should take. I already know how to apply the filter.
Asked
Active
Viewed 605 times
1
-
I have still not clue which package you use and I have the strong feeling that most (if not all) other users are in the same position... – Henrik Schumacher Feb 04 '19 at 20:08
-
Possible duplicate of Savitzky-Golay Filter to smooth noisy data – SPPearce Feb 04 '19 at 20:10
-
I guess i don't know how to frame the question.Ignore the package part. I already know how to apply filters and just want to know how to get derivative. What i'm basically asking is what's the approach to take in applying Savitzky–Golay method to find the first derivative. – Maine Feb 04 '19 at 20:12
-
3@Maine Please add a minimal example to your question - copy-pasteable code that will work on any given computer - or we simply won't be able to help you. – Carl Lange Feb 04 '19 at 20:53
1 Answers
4
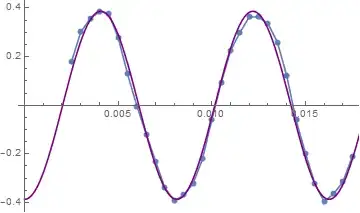
This may be what you want. First I generate a sine wave with some noise.
data = Table[{t, Sin[2 π 123 t] + RandomReal[{-0.2, 0.2}]}, {t, 0,
    0.02, 0.0005}]; Dimensions@data
{41, 2}
Show[
 ListLinePlot[data, Mesh -> All],
 Plot[Sin[2 π 123 t], {t, 0, 0.02}, PlotStyle -> Purple]
 ]

Now we generate the kernel of a derivative filter for Savitzky Golay smoothing.
k = SavitzkyGolayMatrix[{5}, 3, 1];
Look this up in Help. We now apply this to the data using ListConvolve
c = ListConvolve[k, data[[All, 2]]];
Here I have lost 5 points from the start and end of the data due to the convolution process. Putting this back with the time base and plotting the analytical derivative of the sin curve (which is cos) we can see if the smoothed derivative has worked.
Show[
 ListLinePlot[Transpose[{data[[All, 1]][[6 ;; -6]], c}], Mesh -> All],
 Plot[-0.0005 2 π 123 Cos[2 π 123 t], {t, 0, 0.2},
  PlotStyle -> Purple]
 ]
This is a reasonable calculation of the derivative. I had to put in the time increment because that is not included in the filter. I am not sure why I needed the negative sign. I will have to experiment more.
Hope that helps.
Hugh
- 16,387
- 3
- 31
- 83
-
Isn't there a sign error here in the derivative? The negative sign should be with the filter output, not the derivative function. – BioPhysicist Sep 14 '21 at 19:48
-
1I think I agree. The filter should output negative values. The derivative of sin is cos. – Hugh Sep 14 '21 at 20:22