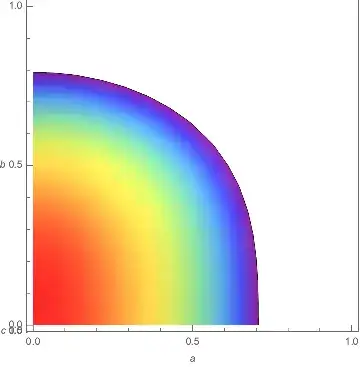
I would like to project the output of RegionPlot3D onto a 2D plane. Basically I'd like to turn this
f = a^2  + b^3 + c;
RegionPlot3D[f <= 0.5, {a, 0, 1}, {b, 0, 1}, {c, 0, 1},
 AxesLabel -> Automatic, ColorFunction -> "Rainbow",
 ViewPoint -> Above, Mesh -> None]
into something more like a contour plot (colour showing what the c value is). I am only interested in the maximum value for c that will satisfy the constraints - so I would like to project onto a 2D plane.
My actual functions are considerably more complex, and the 3D image makes it harder to see the detail.
a,b, orc, or are they trapped in a complicated implicit relationship? – J. M.'s missing motivation Mar 27 '19 at 06:53