3

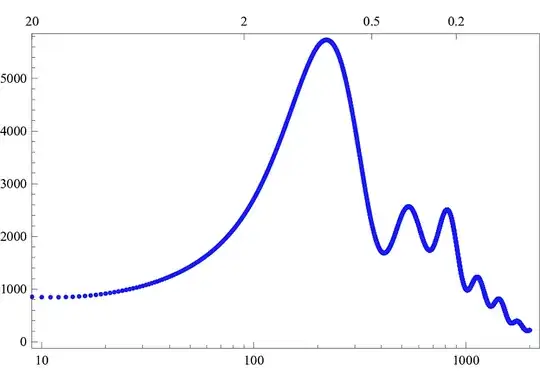
Let us take CMB spectrum as an example. I get data of $C_l$ as a function of multipole moment $l$. Also, multipole moment is a function of angular scale. The question is: how to make a plot with a frame and two different scales on the x-axis as on the plot below

CMB power spectrum

EDIT: See below for what I've done. Any easier way of doing it?

ListLogLinearPlot[a, Frame -> True, 
FrameTicks -> {{Automatic, 
None}, {{{10, 
  10}, {20, , {.006, 0}}, {30, , {.006, 0}}, {40, , {.006, 
   0}}, {50, , {.006, 0}}, {60, , {.006, 0}}, {70, , {.006, 
   0}}, {80, , {.006, 0}}, {90, , {.006, 0}}, {100, 
  100}, {200, , {.006, 0}}, {300, , {.006, 0}}, {400, , {.006, 
   0}}, {500, , {.006, 0}}, {600, , {.006, 0}}, {700, , {.006, 
   0}}, {800, , {.006, 0}}, {900, , {.006, 0}}, {1000, 
  1000}, {2000, , {.006, 0}}}, {{360, "0.5"}, {90, "2"}, {900, 
  "0.2"}, {9, "20"}}}}, AxesOrigin -> {10, 0}]

enter image description here

Luke
  • 183
  • 1
  • 8

2 Answers2

4

You just need to set the FrameTicks properly:

Plot[Sin[x], {x, 0, 2}, Frame -> True, 
  FrameTicks -> {{Automatic, 
  None}, {{{0, "A"}, {1, "B"}, {2, "C"}}, {0, .5, 1, 1.5, 2}}}]

enter image description here


Update

Suppose that this function is the function that relates the bottom and the top axis:

f[x_] := 360 Degree - x

We can now apply this function to the axis above in this way:

Plot[Sin[x], {x, 0, 2 Pi}, Frame -> True, 
 FrameTicks -> {{Automatic, 
    None}, {Range[0 Degree, 360 Degree, 90 Degree], 
    Transpose[{Range[0 Degree, 360 Degree, 90 Degree], 
      f[#] & /@ Range[0 Degree, 360 Degree, 90 Degree]}]}}]

enter image description here

VLC
  • 9,818
  • 1
  • 31
  • 60
  • I think the questions aims at the changing log scale of the bottom x-axis. – Markus Roellig Feb 15 '13 at 14:47
  • I can do something like that but then I would have to calculate angular scale on the paper and put ticks manually. What if I know the relation between top and bottom axis and I wan to somehow couple them together so I don't have to do calculations on the paper.. – Luke Feb 16 '13 at 18:18
  • @Luke Please, see update. – VLC Feb 16 '13 at 18:40
  • In the end I've done it manually since I don't know how to make it work in log scale (ticks per log interval), see edit – Luke Feb 17 '13 at 03:38
  • @VLC Afaik, FrameTicks takes 4 lists (or values like None, Automatic, etc.). Why is it possible to enter a transposed list (list of tupels)? This is not documented, is it? – keyx Oct 12 '15 at 16:30
4

You can specify only the ticks for the edge of the frame that you want to change, and Automatic for the rest, like this:

a = Table[Sin@x + 0.3 Cos@x, {x, 0, 10, 0.01}];

x2 = {{9, "20"}, {90, "2"}, {360, "0.5"}, {900, "0.2"}};

ListLogLinearPlot[a, PlotRange -> All, Frame -> True, 
 FrameTicks -> {{Automatic, Automatic}, {Automatic, x2}}
]

Mathematica graphics

You can also use a function that generates a list of ticks ticks given a low and high value. If you describe the the scale of your second X axis perhaps I can give you an example.

Mr.Wizard
  • 271,378
  • 34
  • 587
  • 1,371
  • The bottom x axis is multipole moment $l$, the top one is angilar scale $\theta$ and relation between them is simply $\theta=180/l$ – Luke Feb 17 '13 at 16:43