My question is based on the discussion that I started: Plot, extract data to a file
The method proposed works well for the Plot command, but what about LogLinearPlot? This was the original motivation when I started the thread. I wanted to extract the data for LogLinearPlot, because I wanted a tighter grid for r $\approx$ 0. Otherwise, I could have just used Table and wouldn't have started the thread. This doesn't work with Table, which produces a uniform grid.
Anyways, this is my code:
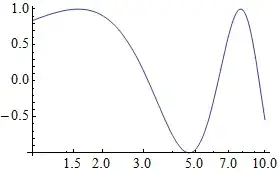
LogLinearPlot[{f[r]*r, 0}, {r, 0.0001, 1000}, PlotRange -> {-0.5, 0.2}, MaxRecursion -> 15]
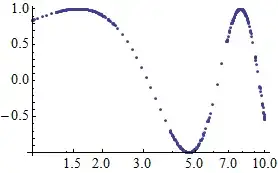
data = Cases[%, Line[data_] :> data, -4, 1][[1]];
Export["~/Desktop/1.dat", SetAccuracy[%, 10], Alignment -> Center]
The catch is that it produces a relative positions of the points on the r axis for the 1st column (r coordinates of the points they would have if the r-axis wasn't set to be logarithmic on the plot).
For example,
-9.210340043    -0.044128619
-9.210320733    -0.04412862
 ......
whereas I was expecting something like this:
 0.000110000    -0.044128619
 0.000170000    -0.04412862
 ........
The origin of the "fictitious" and real axes coincide. How do I get the actual values of r?
Plot[]mesh, although achievable, doesn't seem justified. You could design your own "meshing" algorithm, fitted specifically to your problem. – Dr. belisarius Feb 22 '13 at 02:33