7

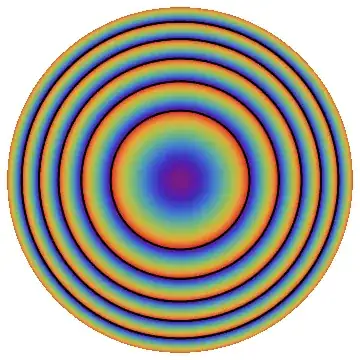
I'm trying to render an equation in the cylindrical coordinates, and I used the following codes:

With[{λ = 1, f = 50, R = 25},
 ContourPlot[
   -Mod[(Pi/λ)*(Sqrt[ρ^2 + f^2] - f), Pi] /. {ρ -> Norm[{x, y}], ϕ -> ArcTan[x, y]},
   {x, -R, R}, {y, -R, R},
   Contours -> 20, ContourLines -> False,
   RegionFunction -> (Sqrt[#1^2 + #2^2] < R &),
   ColorFunction -> "Rainbow", Frame -> False]]

However, I got a pattern which seems not smooth because points were sampled equally in the Cartesian coordinates. How can I get a smooth contour plot? Furthermore, can I plot such a pattern in the 3D coordinates? Thanks a lot.

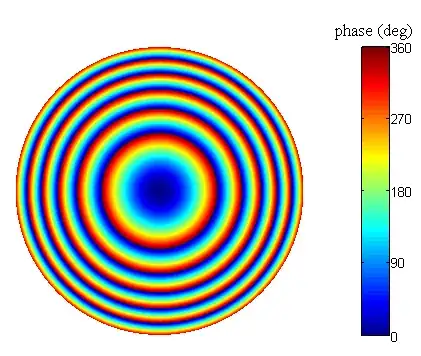
Here is an example of the output that I would like:

enter image description here

Mr.Wizard
  • 271,378
  • 34
  • 587
  • 1,371
Tony Dong
  • 869
  • 9
  • 16
  • I added your graphic as an example for you, as I know the site does not let you do that yet. – Mr.Wizard Mar 08 '13 at 01:06
  • Tony, if my post fully answers your question please consider Accepting it. If not, please tell me in what way it is lacking. – Mr.Wizard Mar 09 '13 at 00:34
  • @ Mr. Wizard, I'll do that. You were good but the 3d plot was not exactly what I want. Probably I didn't describe it clearly. I intend to plot the same pattern in 3D coordinates, say, the target-sheet-shaped preservers. It seems to shear and/or rotate 2d graphics with certain viewpoint. Thanks anyway. – Tony Dong Mar 09 '13 at 02:29

1 Answers1

7

First, your function can be simplified:

FullSimplify[
  -Mod[(Pi/λ)*(Sqrt[ρ^2 + f^2] - f), Pi] /.
     {ρ -> Norm[{x, y}], ϕ -> ArcTan[x, y]},
  Element[x | y, Reals]
]
-Mod[(Pi*(-f + Sqrt[f^2 + x^2 + y^2]))/λ, Pi]

Second, you appear to want a DensityPlot rather than a ContourPlot.

Third, you can get smoother graphics by increasing PlotPoints:

With[{λ = 1, f = 50, R = 25},
  DensityPlot[
    Mod[(Pi*(-f + Sqrt[f^2 + x^2 + y^2]))/λ, Pi],
    {x, -R, R}, {y, -R, R},
    ColorFunction -> "Rainbow",
    Frame -> False,
    PlotPoints -> 100,
    ExclusionsStyle -> Black,
    RegionFunction -> (Sqrt[#1^2 + #2^2] < R &)
  ]
]

Mathematica graphics

Or as a Plot3D:

With[{λ = 1, f = 50, R = 25},
 Plot3D[Mod[(Pi*(-f + Sqrt[f^2 + x^2 + y^2]))/λ, Pi],
  {x, -R, R}, {y, -R, R},
  ColorFunction -> "Rainbow",
  PlotPoints -> 25,
  RegionFunction -> (Sqrt[#1^2 + #2^2] < R & )
 ]
]

Mathematica graphics


Incorporating R.M's suggestions from the comments:

jet[u_?NumericQ] /; 0 <= u <= 1 := 
 Blend[{{0, RGBColor[0, 0, 9/16]}, {1/9, Blue}, {23/63, Cyan}, {13/21, Yellow},
  {47/63, Orange}, {55/63, Red}, {1, RGBColor[1/2, 0, 0]}}, u]


With[{λ = 1, f = 50, R = 25},
  ArrayPlot[Table[
    If[Norm[{x, y}] < R, Mod[(Pi*(-f + Sqrt[f^2 + x^2 + y^2]))/λ, Pi], None],
    {x, -25, 25, 0.1}, {y, -25, 25, 0.1}
   ], ColorFunction -> jet, Frame -> False
  ]
]

Mathematica graphics

Mr.Wizard
  • 271,378
  • 34
  • 587
  • 1,371
  • Thanks Mr. Wizard, I can actually get the same figure as you shown. But I wanna cut out the corners, say, just show the circular patterns. – Tony Dong Mar 08 '13 at 00:18
  • @Tony Sorry, I removed one too many options in my attempt to simplify things. Please look again and tell me if this helps. – Mr.Wizard Mar 08 '13 at 00:20
  • That's exactly what I want. Thank you so much. – Tony Dong Mar 08 '13 at 00:22
  • @Tony I just noticed that ϕ (phi) does not appear to be used in the function. What am I missing? What do you intend? – Mr.Wizard Mar 08 '13 at 00:26
  • @Wizard, you used ExclusionsStyle -> Black, it just covered the noncontinuous points in the figure. However if we mesh the grid in cylindrical coordinates, we will get a smooth figure. I know this can be done in MATLAB by using pol2cart. I'm wondering if there is a similar way in Mathematica. – Tony Dong Mar 08 '13 at 00:31
  • @Tony I'm not familiar with MATLAB so I may not understand what you want. What should be done with those discontinuities? I thought painting them black was reasonable. In the Plot3D graphic I just added they default to style None and appear transparent. How would you have them drawn? Can you put an image of the output from MATLAB on http://imgur.com/ ? – Mr.Wizard Mar 08 '13 at 00:41
  • @Wizard, you were good; phi doesn't appear in the function indeed, the function just is a function of rho. – Tony Dong Mar 08 '13 at 00:41
  • 1
    @TonyDong You don't see the exclusions in MATLAB only because you're doing a finite sampling without any consideration for the function's discontinuities. DensityPlot as Mr.Wizard used here is "aware" of the discontinuity, which is why we have to deal with Exclusions. If you instead sample the domain and plot it using ListDensityPlot, then you'll reproduce MATLAB's figure. Also, see this answer if you want to reproduce the jet colorscheme. – rm -rf Mar 08 '13 at 04:44
  • Thanks, @rm -rf, alright, I got the point. I don't care much about the color map actually, you and Mr.Wizard did a great work though. – Tony Dong Mar 08 '13 at 05:22