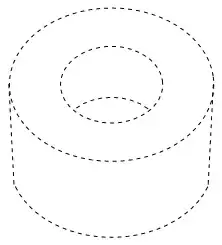
I once wrote something to highlight the edge of graphs of $z = f(x,y)$. The key is to notice that the property of an edge is that the surface normal is orthogonal to the direction from the view point. One can construct a function for MeshFunctions that will draw the edge. The result is pretty good, but sometimes the edge lines seem thinner. I thought it might be the surface partially obscuring them.
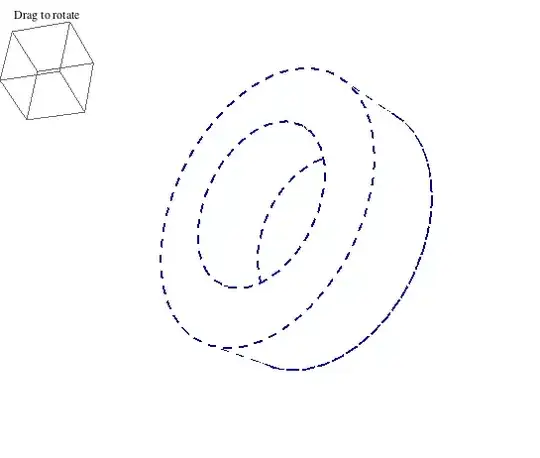
Below the outline is updated dynamically as the little box is rotated. Because the outline is recreated when it is rotated, it cannot be rotated directly (it destroys itself when you try -- well, more precisely, the graphic being rotated is replaced by a new one).
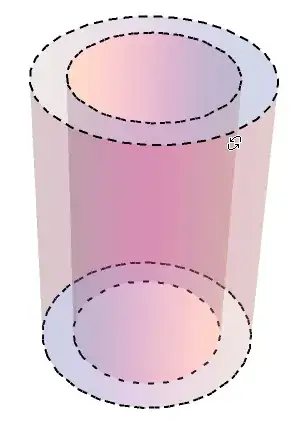
The mesh function is parametricFaceCosine, which returns the CosineDistance of the surface normal and the vector from the view point to the point on the graph. This is equal to 1 when the vectors are orthogonal. I used the value 0.95, which draws the mesh lines slightly in front.
radius1 = 3; radius2 = 5; height = 3;
parametricFaceCosine[f_, viewPoint_] :=  (* assumes f is a function of s, t !! *)
  Function[{xx, yy, zz, ss, tt},
   CosineDistance[D[f, s]\[Cross]D[f, t] /. {s -> ss, t -> tt},
    {xx - viewPoint[[1]], yy - viewPoint[[2]], zz - viewPoint[[3]]}]];

DynamicModule[{viewVec, vert, caps, corners},
 With[{f1 = {radius1 Cos[t], radius1 Sin[t], s},
   f2 = {radius2 Cos[t], radius2 Sin[t], s}},

  viewVec = {Max[2 radius2, height] {1.3, -2.4, 2}, Scaled[{0.5, 0.5, 0.5}]};
  vert = {0, 0, 1};
  caps = RegionPlot3D[radius1^2 <= x^2 + y^2 <= radius2^2 && (z == 0 || z == height),
   {x, -radius2, radius2}, {y, -radius2, radius2}, {z, 0, height},
   PlotStyle -> White, BoundaryStyle -> Directive[AbsoluteDashing[8], Darker@Blue, Thick],
   Mesh -> None, NormalsFunction -> None (* for speed *)];

  Row[{
    Graphics3D[{}, (* rotation control *)
     ViewVector -> Dynamic[viewVec], ViewVertical -> Dynamic[vert],
     PlotLabel -> "Drag to rotate", BaselinePosition -> Top],

    Dynamic@Show[ (* cylinder *)
      ParametricPlot3D[{f1, f2}, {s, 0, height}, {t, 0, 2 \[Pi]},
       PlotPoints -> {2, 15}, PlotStyle -> White,
       BoundaryStyle -> None,
       Mesh -> {{0.95}}, (* edge is exactly at 1; 0.95 is slightly in front *)
       MeshFunctions -> {parametricFaceCosine[f1, viewVec[[1]]]},
       MeshStyle -> Directive[AbsoluteDashing[8], Darker@Blue, Thick],
       NormalsFunction -> None (* for speed *)],
      caps,
      Axes -> None, Boxed -> False, Lighting -> {{"Ambient", White}},
      ViewVector -> Dynamic[viewVec], ViewVertical -> Dynamic[vert],
      BoxRatios -> Automatic, SphericalRegion -> True,
      ImageSize -> 450, BaselinePosition -> Top
      ]
    }]
  ], SaveDefinitions -> True]


viewVecis the viewpoint in the coordinate system of the graphics. It needs to be far enough away from the object. I've improved it. One often has to tweak it for the job at hand. – Michael E2 Mar 10 '13 at 22:48Row[{...}]withOverlay[{...},All,1]to rotate the graph "directly". – kglr Apr 06 '14 at 18:43