1

See the link to plot at the bottom of this post, it is a function of the spherical coordinates theta and phi. It is generated by MatrixPlot of an Array of data. I would like to plot this onto a sphere of arbitrary radius. Any ideas?

Here's the code used to generate the plot.

  lp=1;
  a = 1;
  e1 = a {-Sqrt[3]*lp/2 + Sqrt[3]/2, lp/2 - 3/2};
  e2 = a {-Sqrt[3]*lp/2 + Sqrt[3], lp/2};
  e3 = a*lp {-Sqrt[3]/2, 1/2};

  phi1 = ArcTan[e1[[1]], e1[[2]]] - phi0 + Pi/2;
  phi2 = ArcTan[e2[[1]], e2[[2]]] - phi0 + Pi/2;
  phi3 = ArcTan[e3[[1]], e3[[2]]] - phi0 + Pi/2;

  c1 = (1 - 3*(Sin[theta0])^2*(Cos[phi1])^2)/(Norm[e1]^3);
  c2 = (1 - 3*(Sin[theta0])^2*(Cos[phi2])^2)/(Norm[e2]^3);
  c3 = (1 - 3*(Sin[theta0])^2*(Cos[phi3])^2)/(Norm[e3]^3);

  Clear[phi0];
  Clear[theta0];
  Clear[colorMat];
  count1 = 0;
  count2 = 0;
  step = 0.003;
  nstepsPhi = Floor[(2*Pi - 0)/step + 1];
  nstepsTheta = Floor[(Pi - 0)/step + 1];
  colorMat = ConstantArray[0, {nstepsPhi, nstepsTheta}];
  Do[
    count1 = count1 + 1;
    count2 = 0;
    Do[
     count2 = count2 + 1;
     thing = (c1^2 - c2^2 - c3^2)/(2*c2*c3);
     If[thing>=0 && thing<=1, colorMat[[count2, count1]] = 0.1 , 
      colorMat[[count2, count1]] = 1]
     , {phi0, 0, 2*Pi, step}]
    , {theta0, 0, Pi, step}]


     MatrixPlot[colorMat]

Solution

First, MatrixPlot includes a small border around the image which appears on the final sphere. Even using the option PlotRangePadding->None, this appeared. So, instead let's use Image to create the image.

img = Image[Map[If[# == 1, {0.94, 0.49, 0.02}, {0.87, 0.77, 0.43}] &, 
  Transpose[colorMat], {2}]];

In this bit of code, the If[#==1, rgb1,rgb2]& business can be interpreted as follows: The colorMat is a 0-1 matrix and we want to change each element into an RGB triple. If the # is 1, we change to rgb1 and If the # is 0, we change it to rgb2. The # / & business refers to a pure function, as you can read about in the Wolfram documentation.

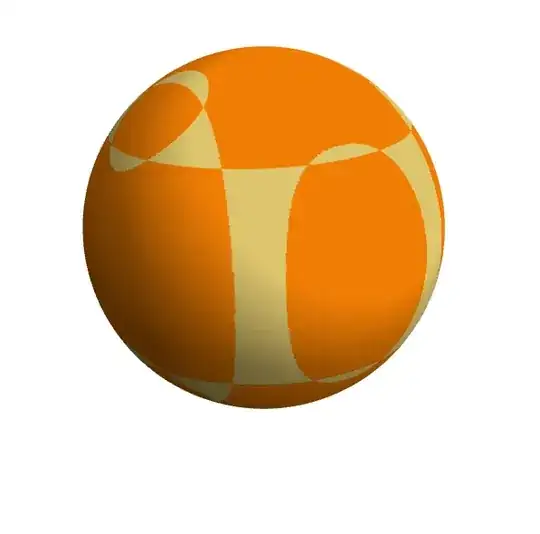
Now, let's map that onto the sphere.

ParametricPlot3D[{Cos[theta] Sin[phi], Sin[theta] Sin[phi], Cos[phi]},
  {theta, -Pi, Pi}, {phi, 0, Pi}, Mesh -> None, PlotPoints -> 101,
  Boxed -> False, PlotStyle -> Texture[img],
  Lighting -> "Neutral", Axes -> False]

enter image description here

Mark McClure
  • 32,469
  • 3
  • 103
  • 161
Tom
  • 3,416
  • 1
  • 18
  • 33
  • It appears that your image was generated with Mathematica. Do you have the code? Regardless, this type of thing has been discussed before. You might be able to adapt the techniques listed here: http://mathematica.stackexchange.com/questions/15047/how-to-draw-fractal-images-of-iteration-functions-on-the-riemann-sphere – Mark McClure Mar 12 '13 at 16:57
  • If you search this site, you'll find several similar questions. Here's one: http://mathematica.stackexchange.com/questions/52/texture-mapping-and-resizing-a-sphere-primitive-in-mathematica – Szabolcs Mar 12 '13 at 17:00
  • Yes. I'll add it now :) just had a look at that link and it boggles my mind a bit but i'll see what sense i can make of it. thanks for the reply. – Tom Mar 12 '13 at 17:04
  • Um, how do I add mathematica code so it looks pretty like in all the other questions? =S – Tom Mar 12 '13 at 17:09
  • @ThomasJebbSturges Just indent the code 4 spaces. – Mark McClure Mar 12 '13 at 17:11
  • @Thomas Click the EDIT link under your post, then on the top right corner of the editor click the ? sign. You'll get a link to the formatting docs. The best way to put this image on a sphere depends on how exactly you generated the image: is it a precomputed matrix (texture) or do you have a function to compute it? – Szabolcs Mar 12 '13 at 17:12
  • @Szabolcs Will he see an "edit" button, as a new user? – Mark McClure Mar 12 '13 at 17:12
  • @Mark Yes, everyone can edit their own posts. – Szabolcs Mar 12 '13 at 17:13
  • Ok great, code is there. It's computed by looping through in steps of theta and phi, and at each point computing if a function is within a certain range. If it is, then one value is stored in an array, if not a different colour. Then I use MatrixPlot to visualise it – Tom Mar 12 '13 at 17:39
  • @ThomasJebbSturges Although this has been marked as a duplicate, your use of MatrixPlot to create the texture does throw a little kink into the process. Since I can't add my own answer, I've edited your question to illustrate the solution. – Mark McClure Mar 13 '13 at 12:50
  • Also, your use of nested Do loops to generate colorMat could certainly be much faster. If you could describe the mathematics behind, it might be easier to figure out how. It looks interesting, whatever it is. – Mark McClure Mar 13 '13 at 12:54
  • Hi Mark, thank you so much for your help and apologies for the late reply (I thought this site would update me to changes so hadn't checked it manually in a while). You've obviously solved the problem so all that's left is my understanding of it! I am modelling an array of metallic nanoparticles with the same lattice structure as graphene as point dipoles, using nearest neighbour approximations. It turns out that for dipoles perpendicular to the plane, the linear, gapless dispersion (and Dirac like physics) of graphene is captured. This plot shows for any arbitrary dipole orientation if... – Tom Mar 21 '13 at 15:42
  • ... the dispersion is gapless (cream) or gapped (orange). This helps to identify the orientations that may still display Dirac like physics, along with the associated benefits such as suppression of backscattering. Mathematically for each value or theta and phi I am checking whether the condition 0 <= (c1^2 - c2^2 - c3^2)/(2c2c3) <= 1, where c1, c2 and c3 are coefficients that depend on theta and phi. Check the bottom section "DERIVATION OF THE CONDITION FOR HAVING A GAPLESS PLASMONIC DISPERSION" of this paper if you're interested: http://arxiv.org/pdf/1209.5005.pdf (by my supervisor) – Tom Mar 21 '13 at 15:53
  • @MarkMcClure Just noticed you can tag people. see above :) – Tom Mar 21 '13 at 17:21
  • @MarkMcClure Although it's working perfectly on my computer I don't understand the first line: img = Image[Map[If[# == 1, {0.94, 0.49, 0.02}, {0.87, 0.77, 0.43}] &, Transpose[colorMat], {2}]]; What is the # referring to? Transpose[colorMat]? And what are the numbers that appear arbitary to me 0.94,0.49,0.02? Any explanation appreciated. I feel uncomfortable using something blindly no matter how well it works! – Tom Mar 21 '13 at 17:32
  • @ThomasJebbSturges Yes, I got your messages now that you've flagged me. I believe that you would be pinged too, if I'd provided and answer, rather than just edited your question. I wasn't able to answer because the question had been closed as a duplicate. It's also similar to my answer here: http://mathematica.stackexchange.com/questions/15047/how-to-draw-fractal-images-of-iteration-functions-on-the-riemann-sphere/16900#16900 I'll make a small edit to clarify the # issue, as well. – Mark McClure Mar 21 '13 at 18:59
  • @MarkMcClure great thank you :) – Tom Mar 21 '13 at 20:35

0 Answers0