OK, the following works within a Manipulate-ListLinePlot environment:
   Clear[x0];
    Manipulate[


     Grid[{{ListLinePlot[
         Table[{x, Sin[x]}, {x, -2 \[Pi], 2 \[Pi], \[Pi]/6}],
         Epilog -> {{Blue, Opacity[0.1],
            Rectangle[{x0 - \[Delta], -1.1}, {x0 + \[Delta], 1.1}]}}],
        "Full Plot"},

       {ListLinePlot[Table[{x, Sin[x]}, {x, -2 \[Pi], 2 \[Pi], \[Pi]/6}],
         Axes -> False, GridLines -> Automatic, AspectRatio -> 1,
         Frame -> True, Filling -> Axis,
         PlotRange -> {{x0 - \[Delta], x0 + \[Delta]}, {-1, 1}}],
        "Zoom View"}}],


      {{\[Delta], \[Pi]/2, "Zoom Level"}, 10^-10,
      2 \[Pi]}, {{x0, 0, "Center"}, -\[Pi], \[Pi]}]

(* this code looks prettier in a notebook! *)
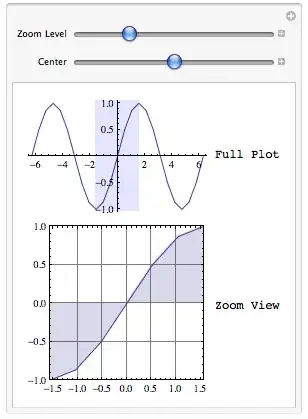
The output looks like this:
You could easily set up two more sliders to control the y-axis pan and zoom, like so:
    Clear[x0, y0];
    Manipulate[

     Grid[{{ListLinePlot[
         Table[{x, Sin[x]}, {x, -2 \[Pi], 2 \[Pi], \[Pi]/6}],
         Epilog -> {{Blue, Opacity[0.1],
            Rectangle[{x0 - \[Delta], y0 - \[Gamma]}, {x0 + \[Delta],
              y0 + \[Gamma]}]}}], "Full Plot"},

       {ListLinePlot[Table[{x, Sin[x]}, {x, -2 \[Pi], 2 \[Pi], \[Pi]/6}],
         Axes -> False, GridLines -> Automatic, AspectRatio -> 1,
         Frame -> True, Filling -> Axis,
         PlotRange -> {{x0 - \[Delta], x0 + \[Delta]}, {y0 - \[Gamma],
            y0 + \[Gamma]}}], "Zoom View"}}],


     {{\[Delta], \[Pi]/2, "x Zoom Level"}, 10^-10, 2 \[Pi]},
     {{x0, 0, "x Center"}, -\[Pi], \[Pi]},
     {{\[Gamma], 0.5, "y Zoom Level"}, 10^-10, 1.1},
     {{y0, 0, "y Center"}, -1, 1}
     ]
Which looks like this:

You can easily fiddle the parameters to suit your aesthetic.