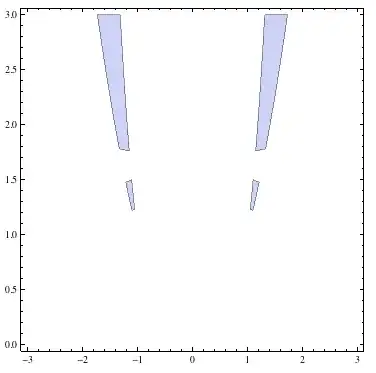
Or, the MaxRecursion:
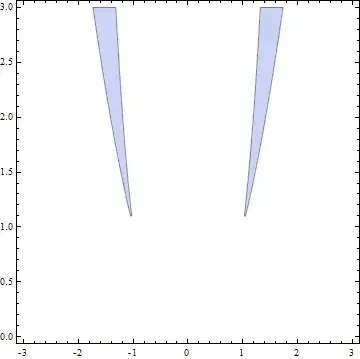
RegionPlot[x^2 < y && y < x^4, {x, -3, 3}, {y, 0, 3},
  MaxRecursion -> 8]
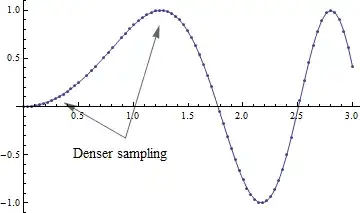
The plot commands generally use a adaptive procedure that is applied recursively. MaxRecursion controls how many times this recursion can be applied. PlotPoints by contrast, simply indicates how many points should be used in the initial grid. It might be simplest to illustrate with the most basic Plot command:
Manipulate[
  Plot[Sin[x^2], {x, 0, 3},
    Mesh -> All, PlotRange -> 1.1,
    MaxRecursion -> mr, PlotPoints -> pp],
  {mr, 0, 8, 1}, {pp, 4, 100, 1}]
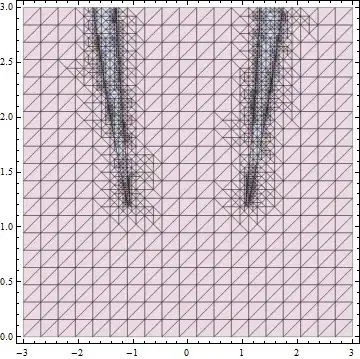
This is a visualization of the sampling mesh for your example function:
RegionPlot[{x^2 < y && y < x^4, Not[x^2 < y && y < x^4]},
    {x, -3, 3}, {y, 0, 3}, Mesh -> All, MaxRecursion -> 4]
PlotPoints -> {100, 150}. – rcollyer Jan 17 '12 at 22:58Plotfunctions. Sometimes Mathematica gets unlucky with sampling the function and you get discontinuities or odd behavior. In almost every case, either increasingPlotPointsorMaxRecursionwill help. – Mike Bailey Jan 17 '12 at 23:24