I tried Wolfram Mathematica, but could not pinpoint an answer.
I tried to plot the function: f: x-> Floor[Sin[x]], but the graph is not even making room in the axis for the only dots of values equal to "1".
These points are only those of x's values equal to any positive integer multiple of Pi/2, where Floor[1] is 1.
The plot command I used is this, just as it should be:
Plot[(Floor@*Sin)[x], {x, -Pi, Pi}]

Around x=Pi/2 there were no accurate plotting of the case x=Pi/2.
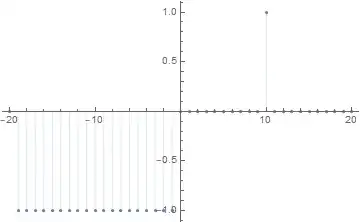
When I adjusted the command to:
Plot[(Floor@*Sin)[x], {x, (Pi - 0.000001)/2, (Pi + 0.000001)/2}] Then the plot did jump to to the case f(x)=f(Pi/2)=1 as it should:

Is there a way to make the plot jump accordingly in other similar cases? After all this was a significant jump of one unit.
Options like PlotRange->All, Exclusions->None or ExclusionsStyle->Red did not bring the missing dot back.