Plot[Tooltip@{1.` k^2, 1.2` k^2, 1.4` k^2, 1.6` k^2, 1.8` k^2, 2.` k^2}, {k, -2, 2}]
gives
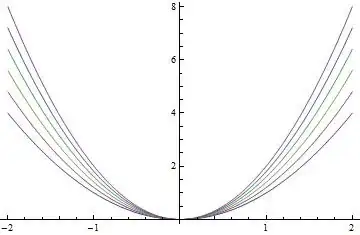
But why does
Plot[Tooltip@Evaluate@Table[a k^2, {a, 1, 2, 0.2}], {k, -2, 2}]
give
 with no color difference?
Plot[Tooltip@{1.` k^2, 1.2` k^2, 1.4` k^2, 1.6` k^2, 1.8` k^2, 2.` k^2}, {k, -2, 2}]
gives
But why does
Plot[Tooltip@Evaluate@Table[a k^2, {a, 1, 2, 0.2}], {k, -2, 2}]
give
with no color difference?
Evaluatehas to be right afterPlot. TryPlot[Evaluate@Tooltip@Table[a k^2, {a, 1, 2, 0.2}], {k, -2, 2}]. – Michael E2 Apr 01 '13 at 02:21Evaluateagain. Under Details it clearly says: "Evaluate only overrides HoldFirst, etc. attributes when it appears directly as the head of the function argument that would otherwise be held". Therefore,Evaluatehas always be the most outwards function of an argument:f[Evaluate[...],...]. – halirutan Apr 01 '13 at 04:13Evaluateoverrides it.Evaluate@Tooltip@Table...evaluates toTooltip@List...before being passed toPlot. I don't know what else to add to halirutan's explanation. – Michael E2 Apr 01 '13 at 10:21