I'm trying for some days now to integrate markers in my legend. I have a ErrorListPlot with markers and a legend but difficulties to realize the markers in the legend as well. Thanks a lot for your answers in advance! Here is my Mathematica Code:
Needs["ErrorBarPlots`"];
Needs["PlotLegends`"];
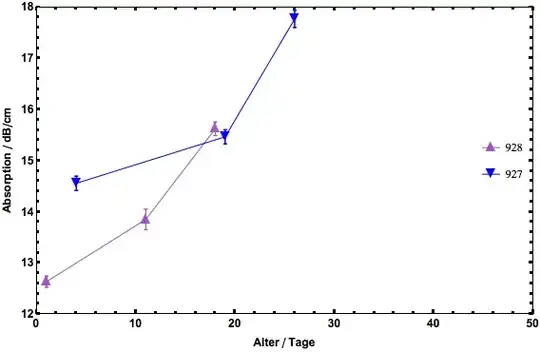
K = {{{4, 14.5566}, ErrorBar[0.2789/2]}, {{19, 15.46581},
ErrorBar[0.27794/2]}, {{26, 17.76820}, ErrorBar[0.33368/2]}};
F = {{{1, 12.634}, ErrorBar[0.216414/2]}, {{11, 13.84994},
ErrorBar[0.402/2]}, {{18, 15.622}, ErrorBar[0.26659/2]}};
ClearAll[simpleLegend]
simpleLegend[legendItems__, pos_] :=
Module[{legendLine, offset, legend},
offset = Module[{s, o, insetpts = 10},
s = pos /. {Left -> 0, Right -> 1, Bottom -> 0, Top -> 1};
o = insetpts pos /. {Left -> 1, Right -> -1, Bottom -> 1, Top -> -1};
Offset[o, Scaled[s]]];
legendLine[{lbl_,
lineStyle_}] := {Graphics[{lineStyle, Line[{{0, 0.5}, {1, 0.5}}]},
ImageSize -> {20, 10}, AspectRatio -> 0.5],
Style[lbl, FontFamily -> "Arial", Bold, FontSize -> 12,
TextAlignment -> Left, LineBreakWithin -> False]};
legend = GraphicsGrid[legendLine /@ legendItems, Alignment -> Left];
Graphics@Inset[legend, offset, pos]]; PlotMarkers -> {{\[FilledUpTriangle],
18}, {\[FilledDownTriangle], 18}};
labels = {"928", "927"};
styles = {Directive[{RGBColor[0.639216, 0.329412, 0.772549]}],
Directive[{Blue}]};
plot = ErrorListPlot[{F, K}, PlotStyle -> styles,
FrameTicksStyle -> Directive[Thick, FontFamily -> "Arial", 12, Bold],
PlotMarkers -> {{\[FilledUpTriangle], 18}, {\[FilledDownTriangle], 18}},
Joined -> True,
PlotRange -> {{0, 50}, {12, 18}},
FrameLabel -> {Style["Alter / Tage", 12, Bold, FontFamily -> "Arial"],
Style["Absorption / dB/cm", 12, Bold, FontFamily -> "Arial"], None,
None}, Frame -> True];
Show[plot, simpleLegend[Thread@{labels, styles}, {Right, Top}]]

edit: for clearing my probelem: I'd like to have the same markers as in the plot in the legend lines as well..

In[*]Out[*]stuff, – Ajasja Apr 02 '13 at 12:48