6

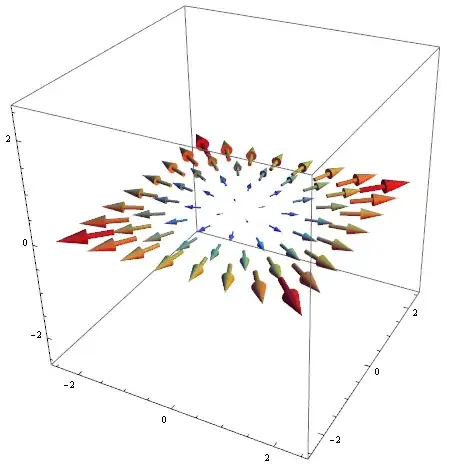
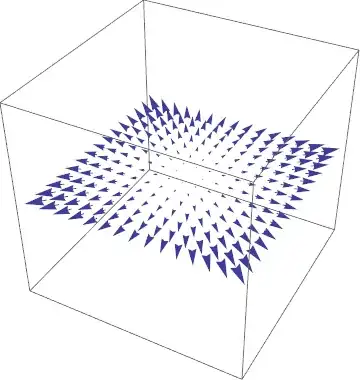
I want to plot a 2D vector function such as $F(x,y) = (a(x,y),\,b(x,y))$ in a 3D graph so that the vectors are embedded in the xy plane. I tried to do the following:

First I defined a piecewise function like this

g[z_] := Piecewise[{{1, z == 0}}, 0]

Then I converted the 2D vector function to a 3D one by setting the 3rd component to zero and multiplying 1st and 2nd components by g[z] so that the x and y components are null when z != 0:

f[x_, y_, z_] := {x g[z], y g[z], 0};

Plot the function:

VectorPlot3D[{x g[z], y g[z],0}, {x, -5, 5}, {y, -5, 5}, {z, -5, 5}]

The issue with this solution is that VectorPlot3D won't evaluate the function in the relevant points, The above example shows an empty graph, because Mathematica jumps from z = -1 to z = 1 without evaluating z = 0.

I tried with RegionFunction (which would've rendered the definition of the above-mentioned piecewise function useless), but that only accepts inequalities, and I want to evaluate the function at any coordinate {x ,y, 0}.

I could feed it a list of vectors via VectorPoints -> { {a, b, 0}, {c, d, 0}, ...}, but that's not an elegant solution at all. Are there other ways to do this?

Verbeia
  • 34,233
  • 9
  • 109
  • 224
DvD
  • 63
  • 4
  • Welcome to Mathematica.SE! I suggest the following: 1) As you receive help, try to give it too, by answering questions in your area of expertise. 2) Read the FAQs! 3) When you see good Q&A, vote them up by clicking the gray triangles, because the credibility of the system is based on the reputation gained by users sharing their knowledge. ALSO, remember to accept the answer, if any, that solves your problem, by clicking the checkmark sign` – Vitaliy Kaurov Apr 02 '13 at 23:33
  • Not a duplicate but an answer related to a comment below by @DvD: http://mathematica.stackexchange.com/questions/18758/how-do-i-draw-lines-perpendicular-to-contour-lines-on-listplot3d/18771#18771 – Michael E2 Apr 03 '13 at 00:13

2 Answers2

8
VectorPlot3D[{x, y, 0}, {x, -2, 2}, {y, -2, 2}, {z, -2, 2},
 RegionFunction -> ((-.1 < #3 < .1) &),
 VectorPoints -> {8, 8, 3},
 VectorStyle -> "Arrow3D",
 VectorColorFunction -> "Rainbow",
 VectorScale -> Scaled[0.15]]

enter image description here

Vitaliy Kaurov
  • 73,078
  • 9
  • 204
  • 355
  • It works fine, although I don't fully understand the syntax. What does #3 mean? Does it represent the third argument of the function? And what does the & operator do? – DvD Apr 02 '13 at 23:24
  • @DvD #3 represents vertical coordinate z. If I wouldn't put limitation with RegionFunction, you would see many parallel identical planes. I limited plotting to a narrow region around a single plane with a constraint in z-coordinate (-.1 < #3 < .1) &. – Vitaliy Kaurov Apr 02 '13 at 23:28
6
Graphics3D[
  VectorPlot[{x, y}, {x, -1, 1}, {y, -1, 1}][[1, 2]] /. 
    Arrow[{{x1_, y1_}, {x2_, y2_}}] :> Arrow[{{x1, y1, 0}, {x2, y2, 0}}
  ]
]

Mathematica graphics

Sjoerd C. de Vries
  • 65,815
  • 14
  • 188
  • 323
  • Combining this result with some other graphs (such as a scalar function) is a bit troubling, but it's helpful to know nevertheless! – DvD Apr 02 '13 at 23:20
  • 1
    @DvD This figure should combine with other graphics just fine. Have you tried Show? – Sjoerd C. de Vries Apr 03 '13 at 05:22
  • Um, back when I formulated my comment, it just showed some huge arrows for some reason. I tried it again and it works now. I can't tell what I did differently this time. – DvD Apr 03 '13 at 10:40