I'm a newbie at Mathematica and I couldn't find how to label the maximum and the zero of a simple function in Plot with their names:
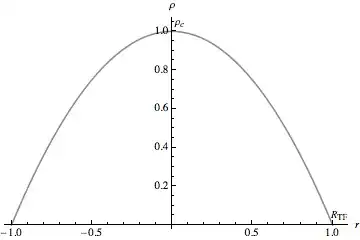
rho[r_] = 1 - r^2;
Plot[rho[r], {r, -1, 1}, AxesLabel -> {r, \[Rho]}]
and i want to show the maximum on the plot with
Subscript[\[Rho], c]
and the point rho[1] with
Subscript[R, TF]

Text[]orInset[]. – J. M.'s missing motivation Apr 03 '13 at 16:15