6

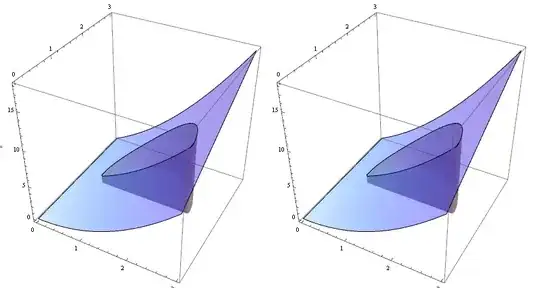
I'm trying to make images like this:

int picture

to illustrate 2D integrals to a calculus class.

I used the code

f1[x_,y_]=x^2+x y;
region1 = (x - 1.5)^2 + (y - 1.5)^2 < 1 && y > 1.5;
fig1 = Plot3D[f1[x, y], {x, 0, 3}, {y, 0, 3}, Mesh -> None, 
   PlotStyle -> Opacity[0.25]];
fig2 = Plot3D[f1[x, y], {x, 0, 3}, {y, 0, 3}, 
   RegionFunction -> Function[{x, y, z}, region1], Filling -> Axis, 
   Mesh -> None, PlotStyle -> {Opacity[.25]}, 
   FillingStyle -> {Gray, Opacity[.5]}];
Show[fig1, fig2]

to make this but would like to automate the procedure, defining a new plot function that takes as input the integration region used by RegionPlot:

IntRegionPlot[f_, region_] := 
  Module[{background, volume}, 
   background = 
    Plot3D[f[x, y], {x, 0, 3}, {y, 0, 3}, PlotRange -> {0, Automatic},
      Mesh -> None, PlotStyle -> Opacity[.25], BoxRatios -> {1, 1, 1}];
   volume := 
    Plot3D[f[x, y], {x, 0, 3}, {y, 0, 3}, 
     RegionFunction -> Function[{x, y, z}, region], Filling -> Bottom,
      Mesh -> None, PlotStyle -> Opacity[.25], 
     FillingStyle -> {Gray, Opacity[.5]}];
   Show[background, volume]];
IntRegionPlot[f1, region1]

But this yields the error

Plot3D::invregion: "(-1+x)^2+(-1+y)^2<1 must be a Boolean function."

What have I done wrong with RegionPlot?

Mr.Wizard
  • 271,378
  • 34
  • 587
  • 1,371
Chris Chudzicki
  • 335
  • 1
  • 2
  • 7

3 Answers3

9

The problem is that the symbols {x, y, z} inside your

 RegionFunction -> Function[{x, y, z}, region]

aren't the same symbols you are using outside the Function[{ },.. ] context. It can be easily solved by passing a whole function like this:

IntRegionPlot[f_, region_] :=  Module[{background, volume}, 
   background = Plot3D[f[x, y], {x, 0, 3}, {y, 0, 3}, PlotRange -> {0, Automatic},
                       Mesh -> None, PlotStyle -> Opacity[.25], BoxRatios -> {1, 1, 1}];
   volume =     Plot3D[f[x, y], {x, 0, 3}, {y, 0, 3}, RegionFunction -> region, 
                       Filling -> Bottom, Mesh -> None, PlotStyle -> Opacity[.25], 
                       FillingStyle -> {Gray, Opacity[.5]}];
   Show[background, volume]];

f1[x_, y_] := x^2 + x y;
region1 = (#1 - 3/2)^2 + (#2 - 3/2)^2 < 1 && #2 > 3/2 &;
IntRegionPlot[f1, region1]

enter image description here

edit

You can also use any other function definition form like:

region1 =  Function[{x, y, z}, (x - 3/2)^2 + (y - 3/2)^2 < 1 && y > 3/2];

or

region1[x_, y_, z_] := (x - 3/2)^2 + (y - 3/2)^2 < 1 && y > 3/2;

Choose the form you like, as long as you pass a function!

finally

Remember that you can easily calculate the integral by:

NIntegrate[f1[x, y] Boole[region1[x, y]], {x, 0, 3}, {y, 0, 3}]
(*
8.46128
*)

or by

Integrate[f1[x, y] Boole[region1[x, y]], {x, 0, 3}, {y, 0, 3}]
(*
1/8 (8 + 19 Pi)
*)
Dr. belisarius
  • 115,881
  • 13
  • 203
  • 453
3
ClearAll[rgnPlt3DF];
rgnPlt3DF[f_, region_, dom_, opts : OptionsPattern[]] :=
   With[{args = Sequence @@ dom[[All, 1]],  
         options = Sequence @@ FilterRules[{opts}, Options[Plot3D]]}, 
       Plot3D[{ConditionalExpression[f[args], region[args]],
               ConditionalExpression[f[args], Not[region[args]]]},
          Evaluate[Sequence @@ dom], options]]

Examples:

f1[x_, y_] := x^2 + y x
rgnF1 = (#1 - 1.5)^2 + (#2 - 1.5)^2 < 1 && #2 > 1.5 &;
rgnF2[a_, b_] := (a - 1.5)^2 + (b - 1.5)^2 < 1 && b > 1.5;
optns = Sequence @@ {Mesh -> None, PlotStyle -> Opacity[0.5], BoxRatios -> 1, 
    ImageSize -> 400, Filling -> {1 -> {Bottom, Directive[Gray, Opacity[.5]]}}};

Row[rgnPlt3DF[f1, #, {{s, 0, 3}, {t, 0, 3}}, optns] & /@ {rgnF1, rgnF2}, Spacer[10]]

enter image description here

kglr
  • 394,356
  • 18
  • 477
  • 896
3

Cause

I think it is important to understand why your code did not work, as it is far from self-apparent.

A simplified illustration of the problem is this:

region1 = (x - 1.5)^2 + (y - 1.5)^2 < 1 && y > 1.5;

test[region_] := Function[{x, y, z}, region]

test[region1]
Function[{x$, y$, z$}, (-1.5 + x)^2 + (-1.5 + y)^2 < 1 && y > 1.5]

Notice the {x$, y$, z$} which does not match the body of the function. This is a case of Mathematica trying to be too clever, if you will. The symbols are silently renamed to avoid a supposed collision.

This tutorial documents the behavior: Variables in Pure Functions and Rules.

Please also see the question: Enforcing correct variable bindings and avoiding renamings for conflicting variables in nested scoping constructs


Solutions

You can Apply Function to a list of arguments to bypass the automatic renaming:

region1 = (x - 1.5)^2 + (y - 1.5)^2 < 1 && y > 1.5;

test2[region_] := Function @@ {{x, y}, region}

test2[region1]
Function[{x, y}, (-1.5 + x)^2 + (-1.5 + y)^2 < 1 && y > 1.5]

But it is better to use a complete function as belisarius shows because the code above will fail if there is a global definition for x or y. Note that this is safe:

x = y = "Fail!";

rf1 = Function[{x, y}, (x - 1.5)^2 + (y - 1.5)^2 < 1 && y > 1.5];

test3[region_] := {RegionFunction -> region}

test3[rf1]
{RegionFunction -> Function[{x, y}, (x - 1.5)^2 + (y - 1.5)^2 < 1 && y > 1.5]}
Mr.Wizard
  • 271,378
  • 34
  • 587
  • 1,371