I would like to draw a list plot with the Y-axis from from 0.00 to 0.40 (rounded to two decimal points). However, it turned out to be that the numbers on the Y-axis have too many numbers after the decimal point. Could you please help me with the issue?

ListPlot[
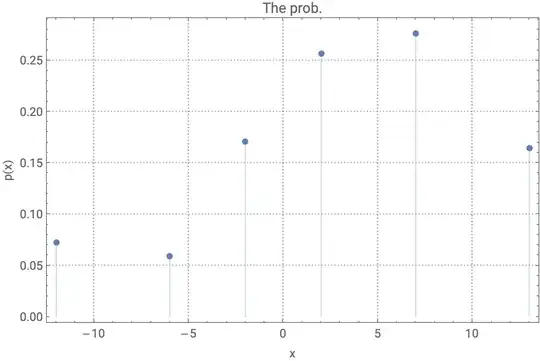
{{-12, .072368}, {-6, .059211}, {-2, 0.1710532}, {2, .2565797},
{7, .27631613}, {13, .164474}},
Filling -> Axis, PlotRange -> All, PlotTheme -> "Detailed",
ImageSize -> 500, PlotLabel -> "The prob.",
FrameLabel -> {"x", "p(x)"},
LabelStyle -> {FontFamily -> "Roboto", FontSize -> 11}]


FrameTicks -> {{{0, 0.1, 0.2, 0.3, 0.4}, None}, {Automatic, None}}. As a variant giving a bit more control try this:FrameTicks -> {{{{0, "0.0"}, {0.1, "0.1"}, {0.2, "0.2"}, {0.3, "0.3"}, {0.4, "0.4"}}, None}, {Automatic, None}}. – Alexei Boulbitch Sep 17 '20 at 07:46SetOptions[$FrontEndSession, PrintPrecision -> 6]and rerun your code. – Michael E2 Sep 20 '20 at 15:24