If you want to see "how normal" your data appears to be, you first need to decide on a metric (or metrics) that characterize the departures from normality that are important to you. You also really need to know what values of those metrics imply "non-normality".
I'd argue that many folks don't know they need to consider both the kind of metric and the size of that metric. But lets suspend disbelief and consider what the Kolmogorov-Smirnov assumes for you.
First the metric used is the maximum distance between the hypothesized cumulative distribution function and the empirical cumulative distribution function from the sample data. In Mathematica one can run the following to test for normality (and that is not a specific normal distribution but any normal distribution):
SeedRandom[12345];
n = 20;
data = RandomVariate[NormalDistribution[0, 1], n];
h = DistributionFitTest[data, NormalDistribution[μ, σ], "HypothesisTestData"];
h["TestDataTable", {"KolmogorovSmirnov"}]

So the maximum distance between the empirical distribution of the sample and the hypothesized normal distribution with the same mean and standard deviation is 0.155088.
If that were the "true" value from a humongous sample, would that be considered a large value? Large enough to jettison the assumption of normality? I don't know. I don't know physics, chemistry, engineering, and a whole sort of applied fields but it is certainly up to the subject matter expert to make that decision and different fields will certainly different assessments which also depend on specific objectives.
And to thrown in more complexity, the value observed will be dependent on sample size (i.e., the size of your budget to collect samples which not scientifically related to the research objective).
Now hypothesis testing comes into play. The P-value of 0.242247 states that if the sample came from a normal distribution, then 24.2247% of the time one would observe a larger maximum distance than what was observed. (The P-value is NOT the probability that the hypothesized distribution is true.) The OP mentions Misuse of P-values which is a good read along with the statement from the American Statistical Association.
To duplicate what DistributionFitTest does when testing for normality and find where the largest deviation from the cumulative normal distribution exists, one can execute the following:
(* Sample mean and standard deviation *)
xbar = Mean[data];
(* Note we need to "adjust" the definition of the sample standard deviation *)
sd = StandardDeviation[data]*Sqrt[(n - 1)/n];
(* CDF of normal distribution with same sample mean and sample standard deviation *)
F[x_] := CDF[NormalDistribution[xbar, sd], x]
(* Calculate KS statistic )
data = Sort[data];
ks1 = Table[{data[[j]], j/n, j/n - F[data[[j]]]}, {j, n}];
ks2 = Table[{data[[j]], (j - 1)/n, F[data[[j]]] - (j - 1)/n}, {j, n}];
ks12 = Join[ks1, ks2];
ks = Select[ks12, #[[3]] == Max[ks12[[All, 3]]] &][[1]]
( {-0.633614, 11/20, 0.155088} *)
We see the same value for the KS statistic: 0.155088.
(* Plot results *)
Show[Plot[{CDF[EmpiricalDistribution[data], x],
    CDF[NormalDistribution[xbar, sd], x]}, {x, -3, 3},
  AxesOrigin -> {-3, 0}, Frame -> True,
  FrameLabel -> {"", "Cumulative probability"},
  PlotLegends -> {"Empirical distribution",
    "Normal distribution with same\nsample mean and std. dev."}],
 ListPlot[{{ks[[1]], ks[[2]]}, {ks[[1]], F[ks[[1]]]}}, Joined -> True, PlotStyle -> Red]]
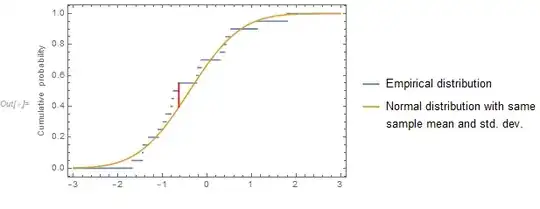
The red line segment shows where the maximum difference occurs.


DistributionFitTestfunction -- or at least the results it provides. If I want to have some measure of how normal my data is, how canDistributionFitTesthelp me? – user27119 Oct 13 '20 at 12:09Suggesting that even Mathematica makes this mistake?
– user27119 Oct 13 '20 at 12:32