I have done fitting of data points with a given model that has two parameters (A and B), using NonlinearModelFit. The result of the fit is the maximum of the likelihood function, aka the best fit, and the best values for parameters A and B, say (A0, B0). On the A-B plot this would be a single point. There is also a standard deviation given for both parameters separately σA and σB. However, the likelihood function should also give a region on A-B diagram, therefore possible values for A and B that give a good fit - the one that is under a certain confidence level, like 68%. This region is not exactly {A-σA, A+σA} × {B-σB, B+σB}. Instead, {A-σA, A+σA} is probably projection of this region on A-axis.
How to get the region of A-B dependence with a specified confidence level (.68, .95, .99) coming from the fit?
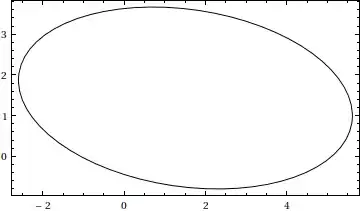
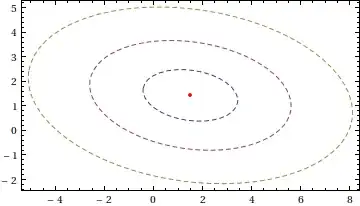
"ParameterConfidenceRegion"in the docs forNonlinearModelFit[]. – J. M.'s missing motivation Apr 17 '13 at 01:17