Running this code:
Histogram[{RandomVariate[NormalDistribution[1/4,0.12],100],
 RandomVariate[NormalDistribution[3/4, 0.12], 100]},
 Automatic, "Probability", PlotRange -> {{0, 1}, {0, 1}},
 Frame -> True, PlotRangeClipping -> True,
 FrameLabel -> {Style["x axis", 15], Style["probability", 15]}
]
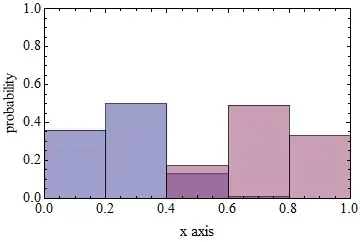
Gives me the following plot:

As you can see, the label on the right ("probability") is not printed correctly. The character "y" is missing. What's going on here?
I am using Mathematica 9.0.0.0. I ran this on two laptops, one with Windows 7 and the other with Windows 8.
Update: Judging by the comments, this seems to be a bug. So now the question becomes: Is there a workaround?
Update: This seems to be bug, so I'll tag as such. In the meantime, see the answers for workarounds.
Stylewrappers? – Brett Champion Apr 26 '13 at 03:18Stylewrappers. I edited to include version and OS. – a06e Apr 26 '13 at 03:38Framed@Style["probability", 15]) shows that the frame is placed incorrectly: a half of the "y" letter is located outside the frame. – Alexey Popkov Apr 26 '13 at 04:44"probability ". – Silvia Apr 26 '13 at 08:11