TL, DR: Use the LightingAngle option to DensityPlot to achieve the same shadows effect as ReliefPlot. (@Brett Champion's answer)
To plot bivariate functions, we typically either use Plot3D, whose dynamic effects allow flexible investigation, or DensityPlot, which is better for publications. However, sometimes the output of DensityPlot is a little ... obscure(?), and shadows from ReliefPlot would add a lot perspective.
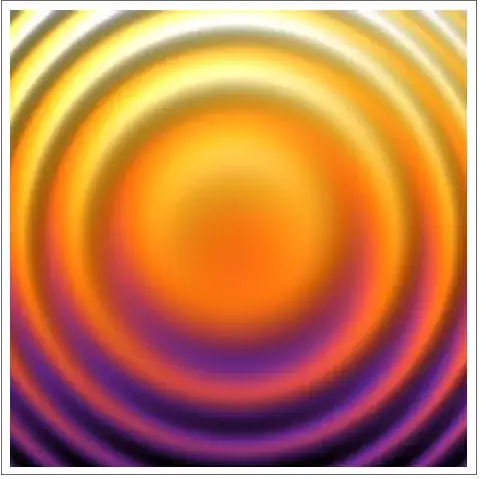
Example from the
ReliefPlotdocumentation:ReliefPlot[Table[i + Sin[i^2 + j^2], {i, -4, 4, .03}, {j, -4, 4, .03}], ColorFunction -> "SunsetColors"]
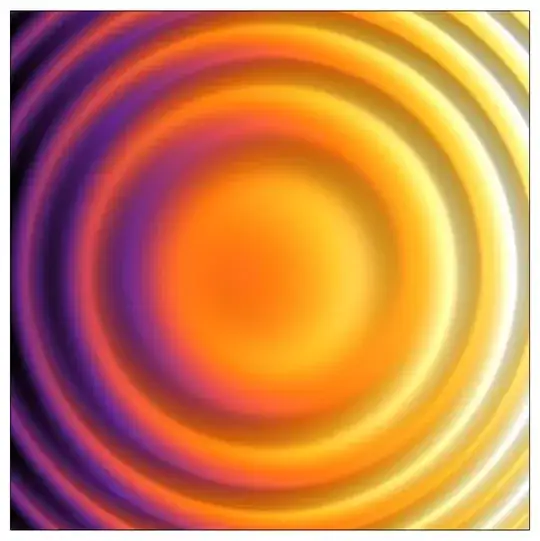
Compare a replication using
DensityPlot:DensityPlot[i + Sin[i^2 + j^2], {i, -4, 4}, {j, -4, 4}, ColorFunction -> "SunsetColors", PlotPoints -> 40]
Where the well-known oddity ofReliefPlot's orientation can be seen.

For years on MMA SE, a lot of members have used ReliefPlot via manual sampling
for function plotting questions
(e.g., this post),
yielding better aesthetic results.
Alternatives include:
- Using
Plot3Dand set the viewpoint at infinity above, but it can also hairy to do. (See @MichaelE2's answer which does this elegantly) - Manually define normal vectors and do a normal mapping, which I am not sure how to implement in Mathematica right now. (See my answer to get a crude idea)
But why isn't ReliefPlot for functions been officially implemented
(i.e., with adaptive sampling like other *Plot* built-ins)?
What is the real technical difficulty?
P.S.: I believe extensive about this problem can already be found on MMA SE (like here and here), but they are scattered everywhere so I am raising this question as a port.
For this thread to serve as a guide to others with the same problem,
what are the ways to mimick ReliefPlot's texture?
(please provide simple code and output examples)
From your personal experience,
at what point should one bother to do this for the nicer touch?
ReliefPlotactually constructs a 3D surface internally; it is a function often used on large geographic datasets, so actual ray tracing would be quite expensive. I do wonder that if the plot is complicated (e.g., when poles occur), employingPlot3Dmay lead to performance issues. I suspectReliefPlotcalculates the gradient of the array and do a normal mapping accordingly. – Gravifer Mar 09 '21 at 04:52Plot3Ddoes not do raytracing either, but calculates the normals (symbolically or numerically, depending on the function).Graphics3Duses the normals (notPlot3D) andLightingto determine the colors of the polygons. (Unless that is done by the GPU. I'm not really up on exactly what GPUs are used to do.)ReliefPlotconstructs aRasterof the colors that it determines. – Michael E2 Mar 09 '21 at 04:55ReliefPlotreturns aGraphicsobject; does it calls uponGraphics3Dfunctionalities internally? I didn't realize that it uses polygon based reflection rendering. – Gravifer Mar 09 '21 at 05:12ReliefPlotactually does what it does internally, but only inferred it from how well it matches thePlot3Doutput. It probably uses the same basic algorithm for 3D shading to determine how to color each square in the raster, but it might use a routine optimized for producing a 2D raster, instead of rasterizing a 3D plot. Note thatReliefPlothas an optionLightingAngle. That and other language in the docs suggest that it produces a 2D rendering of a 3D surface. TheMethodoption can be used to switching between two shading algorithms. – Michael E2 Mar 09 '21 at 05:50Plot3D[i + Sin[i^2 + j^2], {i, -4, 4}, {j, -4, 4}, ColorFunction -> (ColorData["SunsetColors"][#3] &), PlotPoints -> 265, MaxRecursion -> 0, Mesh -> None, ViewPoint -> {0, 0, Infinity}, Lighting -> {{"Ambient", GrayLevel[0.85]}, {"Directional", GrayLevel[0.25], ImageScaled[{-1, 1, Sqrt[2]}]}}, Boxed -> False, Axes -> False]– Michael E2 Mar 09 '21 at 14:42ReliefPlotis really doing is: (1) generate a 2DDensityPlot, embed it in the $xy$ plane in aGraphics3Dbox; the hue of the plot is now acquired; (2) compute the gradient vectors of the target function, use them to construct normal vectors for the (desired) surface: the actual surface is still a flat plane. The normals need not be really perpendicular to the gradient tangents; they just need to be in the same vertical plane. This effectively scales the target function in the $z$ direction. (3) normal mapping for the flat surface. – Gravifer Mar 10 '21 at 02:30ReliefPlotonly let you specify one 'effective' source atLightingAngle -> {$\theta$,$\phi$}, yet still having a nice diffusion effect. One possibility is that the function uses a set of sources like in a photography studio, but I think we can agree this is hard to do. theMethod -> "DiffuseReflection"|"AspectBasedShading"hints that it may use a flat surface with artificial normals instead of a legit 3D surface. – Gravifer Mar 10 '21 at 02:44DensityPlot– Gravifer Mar 10 '21 at 03:02