Consider this example below for ListContourPlot.
ListContourPlot[
  Table[Sin[j^2 + i], {i, 0, Pi, 0.02}, {j, 0, Pi, 0.02}],
  PlotLegends -> Automatic]
I wish to make the Legend look like this:

I have searched the net but did not find any way of doing this. I'm sure this can be done because that legend in the link is created using Mathematica but I can't figure out how.
Maybe it's something very trivial but I would really appreciate if someone could help me with this because I always had a hard time dealing with legends in Mathematica.
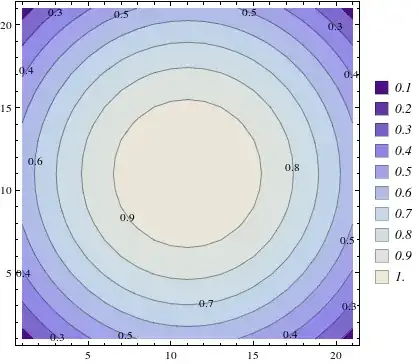
The example that I gave above was just for illustration. My actual function is more like this:-
ListContourPlot[
Table[Cos[Sqrt[bx^2 + by^2]], {bx, -1, 1, 0.1}, {by, -1, 1, 0.1}],
ContourLabels -> All, ColorFunction -> "Rainbow",
  PlotLegends -> BarLegend[Automatic, All]]
So the plot looks like this:-

This legend has clear color bands which can be separated like that shown in the legend above.
So my question is whatever may be the case can we make a legend that looks like the one I showed.