I'm trying to create a function that calculates and plots the sample variogram for a time series. It should take two arguments: data, a time series, essentially a list of reals; k, an integer greater than 0. It should produce a ListLinePlot with $k$ on the horizontal axis and $\hat{G_k}$ on the vertical axis.
The plotting and such isn't really the problem. The problem is getting the mathematical formulas, which are below, into Mathematica formulas.
$\hat{G_k}$ is essentially a ratio of variance at lag $k$ over the variance at lag $1$:
$\hat{G_k}=\frac{s^2_k}{s^2_1},k=1,2,...$
$s^2_k=\frac{\sum_{t=1}^{n-k}(d^k_t-\bar{d}^k)^2}{n-k-1}$
$\bar{d}^k=(n-k)^{-1}\sum{}d^k_t$
$d^k_t=z_{t+k}-z_t$
$z_t$ is the time series of the length $n$.
I've been beating my head against this for a while now. Any help would be appreciated.
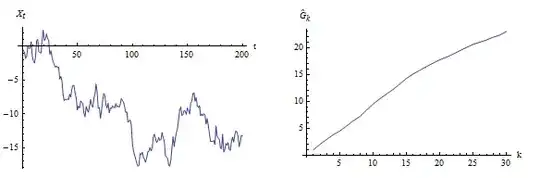
Edit: A variogram is statistical tool to assess whether a time series is stationary or not. For a stationary it starts out at $1$ for $k=1$ and then increases until it starts to hover around a certain value. The theory and formulas I have here is from Time Series Analysis and Forecasting by Example. You might be able to use the Search Inside at Amazon to have a look at it.
Edit2: Here is a demoplot based on dummydata as to how the end result should look for a stationary time series.


ListPlotcan do the same thing asListLinePlot, I removed the version-8 tag. – rcollyer Feb 28 '12 at 19:42ListLinePlotwas "New in 6" -- not a problem even for me ;-) – Mr.Wizard Feb 28 '12 at 20:38