1

I have a 3 dimensional list of points which i would like to extrude in z coordinate with thickness n, i.e. z_{i} -> z_{i}+n for all points in z. There is a similar question concerning 2d list where the z coordinate is by default zero and obtains the thickness n, see Extrude two dimensional list with thickness n . The example list can be found here https://www.dropbox.com/s/mjewq4wnqlqczjb/AdvancedCase.xyz?dl=0

Generally speaking the object can contain holes and can also be an inclined planar. If someone can help me out i would much appreciate it.

user21
  • 39,710
  • 8
  • 110
  • 167
NeAr
  • 285
  • 1
  • 9
  • 2
    I think a big part of this question, like with the other one, is "how do you clean up the point cloud and produce a (2-dimensional extrudable) mesh in the first place", which is a nontrivial problem. – thorimur Apr 01 '21 at 17:13
  • Do you have a list with 3D points or a 3 dimensional list of points (2 or 3D)? If the first: (#+n)&/@ list will add n to the z components. – Daniel Huber Apr 01 '21 at 19:12
  • 2
    If you really want to attract more attention, I would suggest making the problem more attractive. A minimal working example would probably help. The plot of the data below is not encouraging. – Michael E2 Apr 03 '21 at 19:52
  • 1
    Problem is posed insufficient. From the curated answer this is a question for a projection into the xy-plane and the rather noisy data is declared to be without noise. This is very bad question pratice! – Steffen Jaeschke Apr 05 '21 at 09:30

4 Answers4

7

Since no MWE has been forthcoming, here is a demonstration that this functionality is built into ListPlot3D.

Here's some data:

data = Flatten[
   Table[{x, y, Sin[x + 3 Cos[y]]/2}, {x, -3., 3, 0.1}, {y, -3., 3, 0.1}],
   1];
Dimensions@data

(* {3721, 3} *)

ListPlot3D[data]

To get vertical thickness added, use the NormalsFunction option. The thickness is added in the direction of the normal vectors it returns. We can even punch a hole in the mesh with the RegionFunction option.

DiscretizeGraphics@ListPlot3D[data,
  RegionFunction -> Function[{x, y, z}, x^2 + y^2 + z^2 > 2.5],
  Method -> {"Extrusion" -> 0.5}, (* set thickness *)
  NormalsFunction -> ({0., 0., 1.} &)]
Michael E2
  • 235,386
  • 17
  • 334
  • 747
  • 1
    Where do I find such documentation for ListPlot3D with Method -> {"Extrusion" -> 0.5}. – Steffen Jaeschke Apr 04 '21 at 09:41
  • 3
    @SteffenJaeschke It first showed up as a separate option Extrusion -> 0.5, which still works. I found the option by resolving the "ThickSurface" plot theme for Plot3D, although it works for ListPlot3D: Charting`ResolvePlotTheme["ThickSurface", ListPlot3D]. While "ThickSurface" appears in the documentation, the way it is accomplished through the "Extrusion" suboption is not. The Extrusion option is also undocumented, is not among Options@ListPlot3D, and therefore shows up as red when used. – Michael E2 Apr 04 '21 at 14:37
7

As has been mentioned in the comments and previous posts 243594, the data has poor signal-to-noise and therefore requires some cleanup.

Import and view the data

First, we will import the data and Standardizeit so that the points are centered on the mean.

d = Import["AdvancedCase.xyz", "Table"];
d1 = First@d;
(*Translate data to be centered about mean of points*)
d = Standardize[d, Mean, 1 &];
offset = d1 - First@d;
CoordinateBounds[d]
ListPointPlot3D[d, Axes -> True, BoxRatios -> Automatic]

Original data

From the ListPointPlot3D and the CoordinatesBounds, we see that about 20 times the variation is contained in the X and Y coordinates. Therefore, fitting the data to a plane will provide a first-order correction and capture much of the variation in the Z-direction.

Fitting the data to a plane

The following code will fit the data to a plane and rotate it so that the normal aligns with a new z-axis.

(*Find plane that best fits data*)
lm = LinearModelFit[d, {x, y}, {x, y}];
(*Extract plane normal*)
normal = Normalize[{-#2, -#3, 1}] & @@ lm["BestFitParameters"];
(*Find transform function that rotates normal to new z-axis*)
tr = Last@
   FindGeometricTransform[{{0, 0, 0}, {0, 0, 1}}, {{0, 0, 0}, normal}];
(*Rotate extrusion axis into new coordinate system*)
npz = tr[{0, 0, 1}];
(*Find inverse transform*)
itr = tr // InverseFunction;
(*Transform and plot the data*)
td = tr[d];
ListPointPlot3D[td, Axes -> True, BoxRatios -> Automatic]

Transformed data

If we compare this ListPlot image in the new coordinate system to the previous ListPlot image, we see that we have removed much of the variation in the Z direction. We will assume that the surface is flat and that we are only concerned with the X and Y directions. Now, the problem is 2D and it will be easier to apply filters to clean up the data.

Cleanup of 2D data

We will convert the three-dimensional data into two-dimensional data and use image processing techniques to clean up the data as we did in the previously linked answer.

data2d = td[[All, {1, 2}]];
Graphics[{Black, PointSize[0.0025], Point[data2d]}]
{xr, yr} = {MinMax[data2d[[All, 1]]], MinMax[data2d[[All, 2]]]};
image = DeleteSmallComponents@
  GaussianFilter[
   ColorNegate@
    Binarize@
     Rasterize[Graphics[{Black, PointSize[0.0125], Point[data2d]}], 
      "Image"], 5]
im = ImageMesh[image, DataRange -> {xr, yr}]

Image mesh

Conversion to Quad mesh and extrusion

Since I am not quite sure how to handle prisms, we will convert the 2D mesh into quads and then extrude the elements along the new $z'$-axis. Then, we will rotate the coordinates back into the old coordinate system and produce the final MeshRegion.

(*Import required FEM package*)
Needs["NDSolve`FEM`"];
(*Install MeshTools*)
(*Uncomment if not installed*)
(*ResourceFunction["GitHubInstall"]["c3m-labs","MeshTools"]*)
Needs["MeshTools`"]
(*Convert Triangle mesh into Quad mesh*)
Print["Smoothed Quad mesh"]
(mesh2d = 
   SmoothenMesh[
    TriangleToQuadMesh[
     ToElementMesh[im, "MeshOrder" -> 1]]])["Wireframe"]
len = 0.3;(*Extrusion length*)
(*Extract and extrude coordinates*)
crd = mesh2d["Coordinates"];
ncrd = Length@crd;
(*Convert 2D coordinates into 3D*)
crd3d = crd /. {x_, y_} :> {x, y, 0};
crd3dextrude = crd3d /. {x_, y_, z_} :> {x, y, z} + len npz;
(*Join coordinates an inverse transform into original coordinate \
system*)
crd3d = # + offset & /@ itr[Join[crd3d, crd3dextrude]];
(*Convert quad elements into hexahedral elements*)
inc = ElementIncidents[mesh2d["MeshElements"]];
inc3d = First@(inc /. {i_, j_, k_, l_} :> {i, j, k, l, i + ncrd, 
       j + ncrd, k + ncrd, l + ncrd});
(*Create element mesh and convert into mesh region*)
Print["Mesh region"]
mesh3d = MeshRegion@
  ToElementMesh["Coordinates" -> crd3d, 
   "MeshElements" -> {HexahedronElement[inc3d]}]

Final mesh region

Tim Laska
  • 16,346
  • 1
  • 34
  • 58
  • Thanks Tim, your answer is exactly what im looking for. There is one strange thing though, when Im uploading the original data and your result in meshlab, I observed that the coordinates changed. – NeAr Apr 04 '21 at 17:25
  • 1
    @NeAr I Standardized the data (i.e., centered the data on the center-of-mass of the data points). Then, I was only thinking of a rotation transformation on the data points since translation had been taken care of. It was easier for me to think that way. It would not be difficult to add the translation back to your original coordinate system, but I am going to be occupied for a few hours. – Tim Laska Apr 04 '21 at 17:33
  • 1
    @NeAr I shifted the mesh back to the original offset. – Tim Laska Apr 04 '21 at 19:14
  • Maybe at this point Im asking too much, but i will give it a try. Is it possible to make an option if the user wants to consider the object without holes, i.e. an ideal object? – NeAr Apr 04 '21 at 20:00
  • @NeAr If you want to fill in the holes, the simplest way is to use "RegionHoles->None Like so: (mesh2d = SmoothenMesh[ TriangleToQuadMesh[ ToElementMesh[im, "RegionHoles" -> None, "MeshOrder" -> 1]]])["Wireframe"]. Since you are using MeshLab, you can decimate the mesh to reduce the triangle count. – Tim Laska Apr 04 '21 at 21:52
  • @NeAr Hmm... First you are asking about 3D list, but after Tim Laska answer I don't understand your question. Why you asking about 3D while then use 2D? – Alex Trounev Apr 04 '21 at 23:15
  • @TimLaska Well, it is nice answer for set of 2D points imbedding in 3D (+1). But it seems that we discussed set of 3D points. May be in this case it does not matter, but in general case there are different algorithms for 3D points and 2D points. – Alex Trounev Apr 05 '21 at 08:46
  • @AlexTrounev there should be more exposition in the question about the system the OP is trying to solve so we can make better assumptions. Since I had answered two of the OP's previous questions, I knew they were interested in the extrusion of a thin flat wafer ($n=0.3$). The peak-to-peak variation of the points about the fitted 3D plane is about 5X that amount. Needless to say, it will be difficult to find an algorithm that works well with such low signal-to-noise and large aspect ratios. My approach simply applied a first-order correction to the z data, but it is not general. – Tim Laska Apr 05 '21 at 13:11
  • @NeAr What are you commented about? Please read my question and Michel E2 as well under my answer. There are no comments from your side. Also you are not explain your problem for community, that you just need average plane for your set of points. From the other side there is visible curvature in your data, so it is not a plane. How we should suggest what you need if you not explain your problem? – Alex Trounev Apr 05 '21 at 16:28
  • @TimLaska In the case of a inclined planar the object will not be extruded along the z-axis, hence it looks kinda weird. Do you know how to resolve this. – NeAr Apr 07 '21 at 10:42
  • @NeAr since I used two reference frames (i.e., the original coordinate system and the new coordinate system where I aligned the new z-axis with the plane normal), we need to be clear is it the $z$ or $z'$ axis. I believe I extruded it along the z-axis in the original frame. – Tim Laska Apr 07 '21 at 21:08
  • @TimLaska Here is an example of a inclined planar https://www.dropbox.com/s/spagg4l2mncb5b2/wesel_wall_inclined.xyz?dl=0 Unfortunately i can only say that if i extrude this list the lines are not horizontal compared to the example of "AdvancedCase.xyz" where the extruded lines are perpendicular to z axis. One can visualize with meshlab to see what i mean – NeAr Apr 07 '21 at 21:53
  • 1
    @NeAr If you replace npz = tr[{0, 0, 1}]; with npz = {0, 0, 1};, does that give you what you need? – Tim Laska Apr 08 '21 at 01:16
0

This is illustration how to do it with ListPointPlot3D and to show what kind of points we have to plot. Since list uploaded on https://www.dropbox.com/s/mjewq4wnqlqczjb/AdvancedCase.xyz?dl=0 is not structured we can't use it with ListPlot3D. Also there is some noise in these data. Therefore we use first as Steffen recommends

data = Import["...\\AdvancedCase.txt", "Data"]

Then plot data as

ListPointPlot3D[data]

Figure 1

Now we can prepare second list with

n = 2; data1 = Table[data[[i]] + {0, 0, n}, {i, Length[data]}];

We can also plot data and data1 together

ListPointPlot3D[{data, data1}, ColorFunction -> "Rainbow"]

Figure 2

As we understand the question is about how we can prepare 3D object from two set of points data and data1. The simplest way to extrude data along z is prepare set of solid primitives (same as in FEM). We take small subset from data and plot (in this example n=5)

L = Length[data];

dataT = Take[data, {1, L, 25}];

g = Graphics3D[ Table[{EdgeForm[Directive[Thick, LightBlue]], Blue, Opacity[.5], Cylinder[{dataT[[i]], dataT[[i]] + {0, 0, 5}}, .2]}, {i, Length[dataT]}], Boxed -> False, Axes -> True]

Figure 3

Alex Trounev
  • 44,369
  • 3
  • 48
  • 106
-1

Mathematica knows the xyz-file type: XYZ.

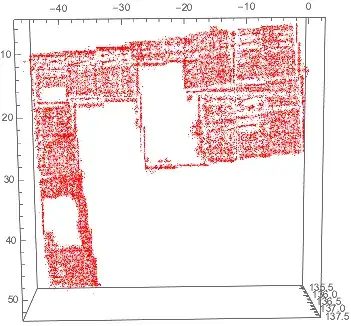
givenlist=Import["https://www.dropbox.com/s/mjewq4wnqlqczjb/AdvancedCase.xyz?dl=0"]

from this documentation page. There rest works as above. But this fails.

Loading this as ASCII shows this:

13.2577219009 -45.3633308411 136.8547973633

13.5088977814 -45.2704734802 136.8559722900

10.8333778381 -45.8802146912 136.6637573242

10.9468536377 -46.1600723267 136.5761871338

13.1572370529 -45.1396865845 136.6828918457

10.7912321091 -45.7505187988 136.6897125244

...

This is already a three-dimensional list. Rename the file type to txt and it is imported.

Import["./../AdvancedCase.txt", "Data"]
ListPlot3D[%20]

ListPlot3D

If the given surface would not have this much and heavy noise then ExtrudeMesh is the solution. This shows how to extrude a Rectangle into a mesh volume in two steps.

allows making a control check whether enough points are considered for the convex hull.

Perhaps this is what You like:

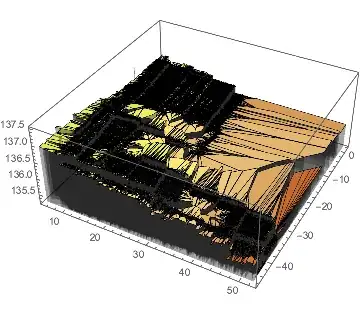
ListPlot3D[%20, Mesh -> None, InterpolationOrder -> 0, 
 ColorFunction -> "SouthwestColors", Filling -> Bottom]

ListPlot3D with shards This is interpolation-free and assumes nothing that may spike. Each value is displayed on a shared basis. The extrusion is now taken to a common base plain. This looks rather different from top and bottom than from the sides views:

enter image description here

There are several types of substructures in the various subregion.

enter image description here

This shows this concave:

ListPlot3D[140 - %20, Mesh -> None, InterpolationOrder -> 0, 
 ColorFunction -> "SouthwestColors", Filling -> Bottom, Mesh -> None]

enter image description here

ListPlot3D[list, Method -> {"Extrusion" -> 0.5}, NormalsFunction -> ({0., 0., 1.} &)]

A nice solution too is

ListPlot3D[list/5, InterpolationOrder -> 0, 
 Method -> {"Extrusion" -> 0.1}, NormalsFunction -> ({0., 0., 1.} &), 
 ColorFunction -> "SouthwestColors"]

solution

I added a scale down factor 0.2 and suppresssed interpolation. This is now a plain extrusion and has a structured downside.

I can not find this method option in my Mathematica documentation. So gratefull thanks to michael-e2!!!

OK! There is a lot of information now added by the comments.

This is a comparison for a methodology smoothing the supposed surface:

ListPointPlot3D[{data, 
  BilateralFilter[data, 2, .5, MaxIterations -> 25]}, 
 PlotStyle -> {Thin, Red}]

smoothing by bilateral filerting

This question offers the smoothing built-ins in Mathematica: remove noise from data

So some smoothing gives another impression of the given surfaces:

ListPointPlot3D[MeanShiftFilter[data, 5, .5, MaxIterations -> 25], 
 PlotStyle -> {Thin, Red}]

enter image description here

From straight line to steps. But some lines get more straight. Other lines appear and some inner points set appear.

enter image description here

It is time do ask again for more information about the intents of the question. The smoothed structures seem to fit to my first preconception of it.

The change is

ListPlot3D[MeanShiftFilter[data, 5, .5, MaxIterations -> 25], 
 Mesh -> None, InterpolationOrder -> 0, 
 ColorFunction -> "SouthwestColors", , Method -> {"Extrusion" -> 0.1},
  NormalsFunction -> ({0., 0., 1.} &)]

proximum

Nice to communicate whether this is the right direction.

ListPlot3D[MeanShiftFilter[data, 5, .5, MaxIterations -> 25], 
 Mesh -> None, InterpolationOrder -> 0, 
 ColorFunction -> "SouthwestColors", Method -> {"Extrusion" -> 0.1}, 
 NormalsFunction -> ({0., 0., 1.} &)]

new view of the data set

Steffen Jaeschke
  • 4,088
  • 7
  • 20