I am continuing my quest on B-splines. The code below builds a 5x5 matrix out of B-splines, using the BSplineBasis[] routine.
I now want to evaluate the polynomials that are stored in each matrix element. The problem that I am facing is, however, that each matrix element corresponds to a different position on my xy-grid.
For instance, B[[2,2]] corresponds to the grid-pint x=-1, y = -1 . B[[2,3]] corresponds to x=-1, y = 0 and so forth.
At the moment I do x = smth and then evaluate the polynomial manually. This works for a small system, but it is not optimal for larger problems.
So my question is, is there some notation that does something like B[[2,3]](put out the value of this matrix element at (x = smth,y = smth))? I tried it with Evaluate[], but didn't get it to work.
knots = {-1, -1, -1 , -1, 0, 1, 1, 1, 1};
B1 = Table[
   D[BSplineBasis[{3, knots}, i, x], {x, 2}] BSplineBasis[{3, knots},
     j, y], {i, 0, 4}, {j, 0, 4}];
B2 = Table[
   BSplineBasis[{3, knots}, i, x] D[
     BSplineBasis[{3, knots}, j, y], {y, 2}], {i, 0, 4}, {j, 0, 4}];
B = B1 + B2;
(*set boundary conditions*)
B[[1]] = {0, 0, 0, 0, 0};
B[[5]] = {0, 0, 0, 0, 0};
B[[All, 5]] = {0, 0, 0, 0, 0};
B[[2, 1]] = BSplineBasis[{3, knots}, 2, x];
B[[3, 1]] = BSplineBasis[{3, knots}, 3, x];
B[[4, 1]] = BSplineBasis[{3, knots}, 4, x];
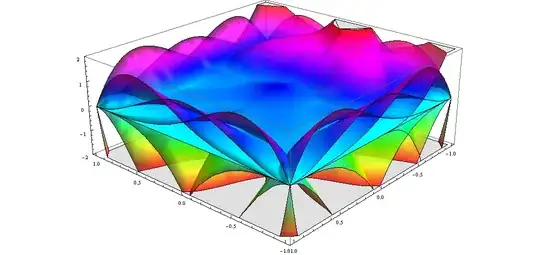
Here is a plot of what I'm doing, just for nurturing the eye.
Plot3D[Evaluate[B], {x, -1, 1}, {y, -1, 1}, Mesh -> None,
 PlotStyle -> Directive[Opacity[0.8]], PlotRange -> {-2, 2},
 ColorFunction -> Function[{x, y, z}, Hue[z]]]
B[[2,3]]corresponds to the point(-1,0)? It seems that you want to evaluateB[[2,3]]at that point. Is that correct? Can you just runB[[2,3]]/.{x->-1,y->0}? – Jonathan Shock May 01 '13 at 10:16Power::infy: Infinite expression 1/0 encountered. >>errors when I try to run your code. Can you correct that? – Mr.Wizard May 01 '13 at 10:33