0

I have a data

data = {-35595.14434536`, -35595.15251191`, -35595.15203502`, -35595.15144579`, -35595.15129939`, -35595.15149652`, -35595.15142124`, -35595.15142254`, -35595.15145182`};

Plot it using

ListPlot[data, PlotRange -> MinMax[data]]

I got

enter image description here

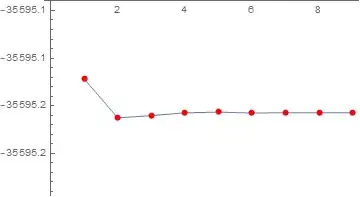
The plot range is not right. I can not see the trend of the data, though the trend is tiny. How to fix the plot range?


Edit

Thank you for Julius's link. The best simple solution I found is in Carl Woll's answer in that link

Show[ListPlot[data], PlotRange -> MinMax[data], Frame -> True]

gives

enter image description here

matheorem
  • 17,132
  • 8
  • 45
  • 115

2 Answers2

3

I do not know why. My guess is that the difference between the min and the max is too small and ignored. The difference is 0.00816655

Here is a workaround meanwhile

data={-35595.14434536`,-35595.15251191`,-35595.15203502`,-35595.15144579`,-35595.15129939`,-35595.15149652`,-35595.15142124`,-35595.15142254`,-35595.15145182`};
{min,max} = MinMax[data];
d = Subtract[max,min];
ListLinePlot[data,PlotRange->{Automatic,{min-2*d,max+2*d}},Mesh->All,MeshStyle->Red]

Mathematica graphics

Nasser
  • 143,286
  • 11
  • 154
  • 359
1

To see the trend you could use

ListPlot[data - Mean[data], 
PlotRange -> {Min[data - Mean[data]] - 10^-1 Min[data - Mean[data]], 
Max[data - Mean[data]] + 10^-1 Max[data - Mean[data]]}]
Andreas
  • 3,297
  • 1
  • 5
  • 12
  • Thank you so much, Andreas. However, if original data is not need, it seems that simple ListPlot[data - Mean[data], PlotRange -> All] works already. – matheorem May 16 '21 at 13:14