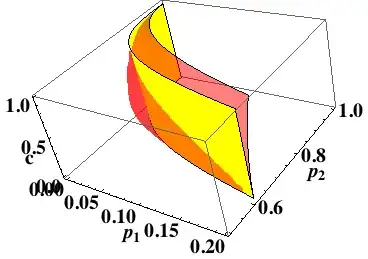
First I have
ContourPlot3D[{
  (1 - p1) (1 - p2)^3 == p1 p2^3,
  p1 p2^6 (c p1 + (1 - c) p2)^3 ((1 - c) p1 + c p2)^2
    == (1 - p1) (1 -p2)^6 (1 - c p1 - (1 - c) p2)^3 (1 - (1 - c) p1 - c p2)^2
 }, {p1, 0.2, 0}, {p2, 1, 0.5}, {c, 0, 1},
Lighting -> ({"Directional", White, #} & /@ Tuples[{-1, 1}, 3]),
Mesh -> None,
BoxRatios -> {2, 2, 1},
ContourStyle -> {Yellow, Directive[Red, Opacity[0.5]]},
BaseStyle -> {FontWeight -> "Bold", FontSize -> 20}]
which will show me (please don't mind the labels)
I want Mathematica to plot the region between the yellow plane and the transparent red plane, so I use RegionPlot3D with the same set of equations.
RegionPlot3D[(1 - p1) (1 - p2)^3 > p1 p2^3 &&
  p1 p2^6 (c p1 + (1 - c) p2)^3 (c p2 + (1 - c) p1)^2
   > (1 - p1) (1 - p2)^6 (1 - (c p1 + (1 - c) p2))^3 (1 - (c p2 + (1 - c) p1))^2,
{p1, 0, 0.2}, {p2, 0.5, 1}, {c, 0, 1},
Mesh -> None, FaceGrids -> All, ViewPoint -> Front,PlotPoints->100]
which will give me the following:
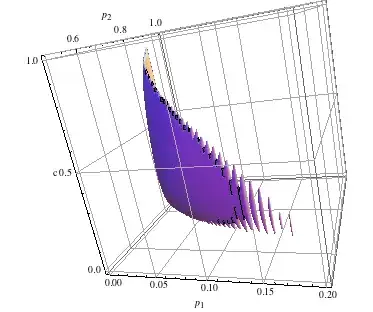
One will expect RegionPlot3D will give a single connected bulk but instead there are several rod-like artifacts. How to get a nice region plot with that set of equations? (Increasing plotpoints to 200 might work, but it takes so long...)
regionBoundaryPlotfunction) whose names contain "$"? – wdg May 10 '13 at 03:55Withrenamed the variables inside it. Check this:With[{y = x}, Function[x, y]]. Note it may not be the best way to inject code intoFunction, please do search relevant posts on this site. – Silvia May 10 '13 at 09:40