2

I am unable to change the frameticks for my list plot.

I am trying to plot a growth rate omega function which looks like this:

Clear[\[Omega]3, \[Omega], \[Epsilon], h, K1, \[Delta], q, Bi, m]
\[Omega]3 = \[Epsilon]/((h + K1)^2) - h^3 q^4 - Bo h^2 q^2 + 
  m q^2 h^2/((h + K1)^2) + \[Delta] h^3 q^2/((Bi h + K1)^3)
\[Omega] = \[Omega]3 /. {\[Epsilon] -> 6.01*10^-8, \[Delta] -> 
    5.19*10^-7, K1 -> 1, Bi -> 1, m -> 0.1092, Bo -> 0}

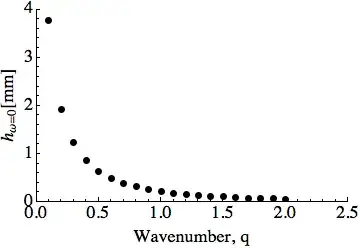
I vary the q via a table and capture the film thickness for omega=0 for

ListPlot[
 Table[
  q = qx;
  2.35 FindRoot[\[Omega] == 0, {h, 1}][[1]][[2]],
  {qx, 0.1, 2, 0.1}
  ],
 PlotRange -> {{0, 21}, {0.0, 4}},
 AxesLabel -> {"wavenumber", "Growth rate"},
 BaseStyle -> {FontSize -> 18},
 Frame -> {True, True, False, False},
 FrameLabel -> {"Wavenumber, q", 
   "\!\(\*SubscriptBox[\(h\), \(\[Omega] = 0\)]\)[mm]"},
 PlotStyle -> Directive[Thick, Black, PointSize[Large]]
 ]

The plot looks like this:

enter image description here

The x axis has grid points and not the values of q. Is there any way I could have q values instead of grid points?

dearN
  • 5,341
  • 3
  • 35
  • 74

3 Answers3

5

There are two ways.

The first way is to specify your data differently to get pairs of numbers like this:

datatoplot = Table[{qx,
   2.35 FindRoot[(\[Omega] /. q -> qx) == 0, {h, 1}][[1]][[2]]}, {qx, 
   0.1, 2, 0.1}]

ListPlot[datatoplot, PlotRange -> {{0, 2.5}, {0.0, 4}}, 
 AxesLabel -> {"wavenumber", "Growth rate"}, 
 BaseStyle -> {FontSize -> 18}, Frame -> {True, True, False, False}, 
 FrameLabel -> {"Wavenumber, q", 
   "\!\(\*SubscriptBox[\(h\), \(\[Omega] = 0\)]\)[mm]"}, 
 PlotStyle -> Directive[Thick, Black, PointSize[Large]]]

enter image description here

Alternatively, use the FrameTicks option to ListPlot to replace the tick label at each point.

ListPlot[datatoplot2, PlotRange -> {{0, 20}, {0.0, 4}}, 
 AxesLabel -> {"wavenumber", "Growth rate"}, 
 BaseStyle -> {FontSize -> 18}, Frame -> {True, True, False, False}, 
 FrameTicks -> {{Automatic, 
    None}, {Transpose[{Range[0, 20, 5], Range[0, 2, 0.5]}], None}}, 
 FrameLabel -> {"Wavenumber, q", 
   "\!\(\*SubscriptBox[\(h\), \(\[Omega] = 0\)]\)[mm]"}, 
 PlotStyle -> Directive[Thick, Black, PointSize[Large]]]

enter image description here

You can tweak the presentation according to taste. Have a look at some of the other questions about Ticks for some ideas.

Verbeia
  • 34,233
  • 9
  • 109
  • 224
  • This is rather interesting. I didn't think that "specifying my data differently" outside the plot function would help me... – dearN May 10 '13 at 14:27
4

I think the fastest way is not to change the ticks but to change the argument of ListPlot to:

Table[
  {q = qx,
   2.35 FindRoot[\[Omega] == 0, {h, 1}][[1]][[2]]
  },
{qx, 0.1, 2, 0.1}
 ]

Edit: so like b.gatessucks said in comment while I was writing this post. :)

m_goldberg
  • 107,779
  • 16
  • 103
  • 257
Kuba
  • 136,707
  • 13
  • 279
  • 740
2

So it looks like an answer has already been accepted but I'd just like to point out what I think is the best way to deal with this.

When you apply ListPlot to a one dimensional list, the x-axis will by default simply be the integers ranging from 1 to the number of data points. But you can use the option DataRange to change this, via

ListPlot[
 Table[
  q = qx;
  2.35 FindRoot[\[Omega] == 0, {h, 1}][[1]][[2]],
  {qx, 0.1, 2, 0.1}
  ],
 PlotRange -> {0.0, 4},
 DataRange -> {0.1, 2},
 AxesLabel -> {"wavenumber", "Growth rate"},
 BaseStyle -> {FontSize -> 18},
 Frame -> {True, True, False, False},
 FrameLabel -> {"Wavenumber, q", 
   "\!\(\*SubscriptBox[\(h\), \(\[Omega] = 0\)]\)[mm]"},
 PlotStyle -> Directive[Thick, Black, PointSize[Large]]
 ]

enter image description here

Jason B.
  • 68,381
  • 3
  • 139
  • 286
  • hmmmm, just noticed that I replied to a 2 year old post here. Why was it on the front page? lol – Jason B. Feb 26 '15 at 14:00
  • Thanks for your answer though! :) I still keep track of questions I started a few years ago ;) – dearN Feb 26 '15 at 15:46