I want to plot several 2D curves (Sin[x] at y=0, Cos[x] at y=1) in a 3D plot, what function should i use?
f[x_, y_] := Piecewise[{{0, y < 0 || y > 0}, {Sin[x], y == 0}}]
g[x_, y_] := Piecewise[{{0, y < 1 || y > 1}, {Cos[x], y == 1}}]
Plot3D[{f[x, y], g[x, y]}, {x, 0, 10}, {y, 0, 10}]
doesn't work. Any ideas?
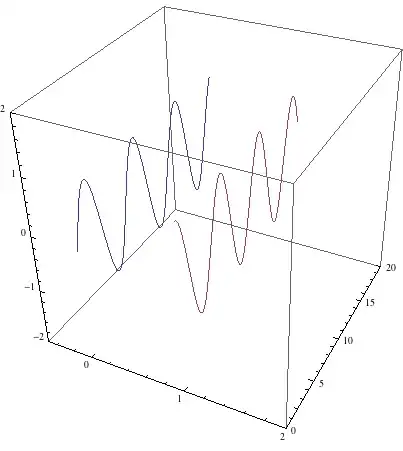

ParametricPlot3D[]? – J. M.'s missing motivation May 11 '13 at 06:37Plot3Ddraws a surface, you needParametricPlot3Dwith one parameter (for a curve) or points forLineandGraphics3D. – BoLe May 11 '13 at 14:03