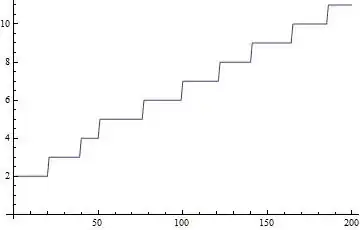
What I do:
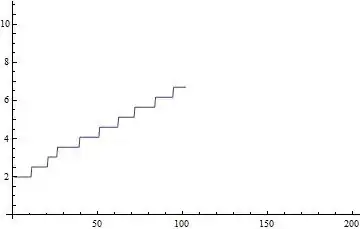
ListPlot,- Select the plot area,
- A tooltip says: Double-click to edit,
- Double-click the line or a point on the line,
- Take a handle to resize the red frame or one of the data points.
- Deselect the
Plot.
Questions:
- Are there new values generated?
- How can you list those new values?