The second update at the end is probably the best solution when ListContourPlot3D produces bad shading.
First answer, with update
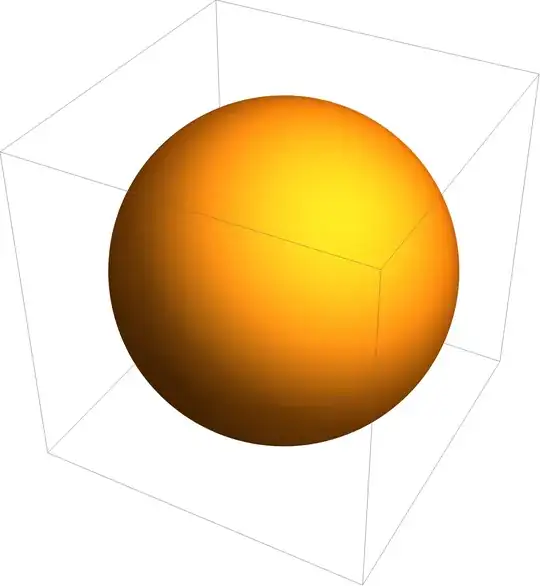
One source of strange shading is bad VertexNormals. They have to be estimated from the data, and if they "wobble" from true normal, the surface's shading changes slightly.
On the test example, we "know" what the surface normal should be. We fix it to show that it fixes the shading. For real data, it seems unusual to know how calculate exactly the normals.
GraphicsRow[{
  foo = ListContourPlot3D[Table[x^2 + y^2 + z^2,
     {x, -1, 1, 0.02}, {y, -1, 1, 0.02}, {z, -1, 1, 0.02}],
    Contours -> {1}, Mesh -> None],
  foo /.
   GraphicsComplex[p_, a___, HoldPattern[VertexNormals -> _], b___] :>
     GraphicsComplex[p, a,
     VertexNormals -> Transpose[Transpose@p - 50], b]
  },
 ImageSize -> 800]

These are easier ways to fix it, but (update) they just remove the vertex normals, which I didn't notice because of the fineness of the mesh:
DeleteCases[foo, HoldPattern[VertexNormals -> _], Infinity]
RegionPlot3D[DiscretizeGraphics[foo]]
(* each produces graphics like this: *)

A way to get the normals from this answer is not so simple, but closed surfaces even when their equations are unknown.
mesh = BoundaryDiscretizeGraphics[foo];
Graphics3D[
 GraphicsComplex[
  MeshCoordinates[mesh],
  {First[
    "DefaultPlotStyle" /. (Method /.
       Charting`ResolvePlotTheme[Automatic, RegionPlot3D])],
   EdgeForm[], Thread[MeshCells[mesh, 2], Polygon]},
  VertexNormals -> Region`Mesh`MeshCellNormals[mesh, 0]
  ]
 ]
Update 2
This does a better job than ListContourPlot3D, but I thought it was basically equivalent to it. It makes the OP's issue seem like a bug in ListContourPlot3D:
ifn = ListInterpolation[Table[x^2 + y^2 + z^2,
    {x, -1, 1, 0.02}, {y, -1, 1, 0.02}, {z, -1, 1, 0.02}]];
ContourPlot3D[ifn[x, y, z], {x, 1, 101}, {y, 1, 101}, {z, 1, 101},
 Contours -> {1}, Mesh -> None]


PerformanceGoal -> "Quality"– Bob Hanlon Sep 18 '21 at 13:31PerformanceGoal -> "Quality"has no effect at all. – matheorem Sep 18 '21 at 13:44MaxPlotPoints ->60? The default is Infinity. – Syed Sep 18 '21 at 14:06MaxPlotPoints ->60seems works. But why does it work? – matheorem Sep 18 '21 at 14:15MaxPlotPointsit says, "With finite settings for MaxPlotPoints, the total number of points plotted is reduced by combining nearby points." Since there were only two settings, I applied the other one to see what would happen. – Syed Sep 18 '21 at 14:19