I have never used image processing with Mathematica. I need to get the coordinates of the red points from this image I made in Illustrator. Is there a way to get Mathematica to read or detect the x-y coordinates?

I have never used image processing with Mathematica. I need to get the coordinates of the red points from this image I made in Illustrator. Is there a way to get Mathematica to read or detect the x-y coordinates?
A solution for Mathematica version 9:
image = Import["https://i.stack.imgur.com/R0Dqo.png"]
pts = PixelValuePositions[image, Red, .2];
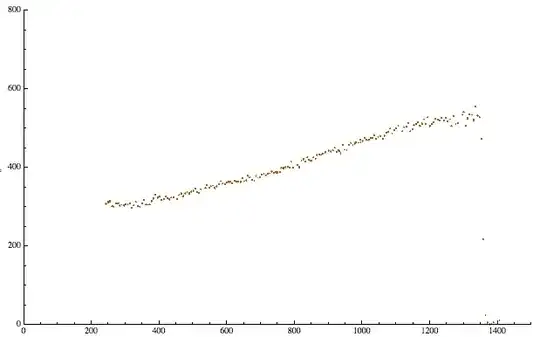
ListPlot[pts,
PlotStyle -> Darker@Orange,
PlotMarkers -> {Automatic, .05},
PlotRange -> {{0, 1500}, {0, 800}},
ImageSize -> 600]
PixelValuePositions so far (seems to be new in MMA 9).
– partial81
Jun 04 '13 at 08:11
pts above)?
– BoLe
Jun 04 '13 at 09:35
PixelValuePositions[Thinning@ColorNegate@ImageCrop@Binarize@image, 1] perhaps.
– BoLe
Jun 04 '13 at 09:37
thinned = DeleteDuplicates[pts, EuclideanDistance[#1, #2] < 2 &] to keep it as data...?
– cormullion
Jun 04 '13 at 10:33
PixelValuePositions proved useful, elsewhere.
– rcollyer
Jun 04 '13 at 19:53
pts = Mean /@ Gather[pts, EuclideanDistance[#1, #2] < 4 &];
– Murta
Jun 05 '13 at 01:29
The question leaves open what a "point" is, as opposed to a pixel.
If points overlap in the image, it is beyond my skill to separate them. Others here have far more experience in image processing and may be able to suggest things, within limits. If the points are separated, then here's a rough stab at finding them:
MorphologicalComponents[Binarize[img, {0.29, 0.6}], 0.68] // Colorize

(rules = ArrayRules[MorphologicalComponents[Binarize[img, {0.29, 0.6}], 0.68]];
  points = Mean /@ Map[First, GatherBy[rules, Last], {2}];) // Timing
Length[points]
{0.072981, Null}
195
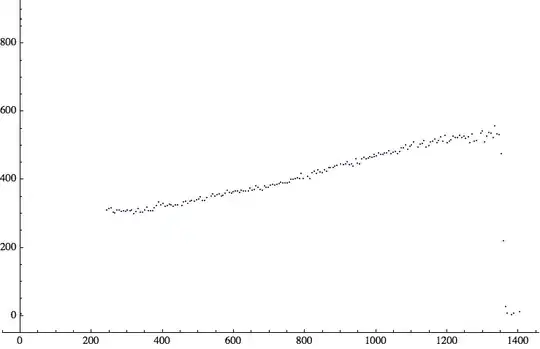
The points are image coordinates; we should convert them to graphics coordinates before plotting:
ListPlot[{#[[2]], Last@ImageDimensions[img] - #[[1]]} & /@ points,
 PlotMarkers -> {Automatic, 2},
 PlotRange -> Transpose[{{0, 0}, ImageDimensions[img]}],
 PlotRangePadding -> 50, AxesOrigin -> {0, -50}]
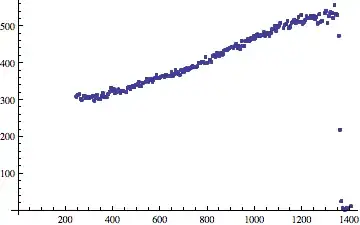
The same method is an efficient way to get the pixels (especially if you do not have v9 and PixelValuePositions to use).
(rules = ArrayRules[MorphologicalComponents[Binarize[img, {0.29, 0.6}], 0.68]];
  pixelCoords = SparseArray[rules]["NonzeroPositions"];) // Timing
Length@pixelCoords
{0.070562, Null}
2629
ListPlot[{#[[2]], Last@ImageDimensions[img] - #[[1]]} & /@ pixelCoords,
 PlotMarkers -> {Automatic, 0.25},
 PlotRange -> Transpose[{{0, 0}, ImageDimensions[img]}],
 PlotRangePadding -> 50, AxesOrigin -> {0, -50}]

This way is nearly as fast and gives the same result as above:
pixelCoords = Position[ImageData@Binarize[img, {0.29, 0.6}], 1]; // Timing
Length@pixelCoords
{0.108690, Null}
2629
Using relatively simple functions:
c = Import["https://i.stack.imgur.com/R0Dqo.png"] ;
a = Rasterize[c];
reds = Cases[Union[Flatten[a[[1, 1]], 1]], {r_ /; r > 200, g_ /; g < 50, b_ /; b < 50}];
Row[{First[Timing[b = Map[Position[a[[1, 1]], #] &, reds]]], " seconds"}]
13.073 seconds
ListPlot[Reverse /@ Flatten[b, 1], PlotStyle -> Red, AxesOrigin -> {0, 0}]

Another way without Mathematica version 9 PixelValuePositions
img = Import["https://i.stack.imgur.com/R0Dqo.png"];
pix = Round[ImageData[img, DataReversed -> True]];
ListPlot[Reverse /@ Position[pix, {1, 0, 0}], AxesOrigin -> {0, 0}]
Binarize[]to the OP's image, the question is now equivalent to the one linked by @partial81; unless I see a reason why this is not a dupe, I'm leaning towards closing this. – J. M.'s missing motivation Jun 04 '13 at 06:36PixelValuePositions[i, Red, .2]be quicker though? – cormullion Jun 04 '13 at 06:47