-1

I am trying to generate a table of data for the function:

f(x) := (Sin[2 Pi t]) (1 + (1/5) Sin[6 Pi t] + (1/10) Sin[8 Pi t])
Table[Plot[f[t], {t, -5, 5}, ImageSize -> {150, 150}], {t, -5, 5}] 

I believe I plotted it correctly by using this syntax tp define the function and make the plot, but I am not sure if I am doing this correctly.

Also, I want to add random noise,but I do not know how.

m_goldberg
  • 107,779
  • 16
  • 103
  • 257
user7891
  • 1
  • 1
  • 1

2 Answers2

3

This post is a partial answer, directed at your question about your syntax, which is incorrect as posted.

In Mathematica, a function function of one variable t is defined with the syntax f[t_] := ..., not f(t) = .... Note the square brackets [ ] and the underscore _ after the the t which identifies t as a variable.

Further, I don't understand why you introduced Table when making your plot. Do you really want 11 copies of the plot? Because that's what your Table expression will deliver.

Here is the correct syntax for what I think you really want:

f[t_] := (Sin[2 Pi t]) (1 + (1/5) Sin[6 Pi t] + (1/10) Sin[8 Pi t])

Plot[f[t], {t, -5, 5}, ImageSize -> {150, 150}]

which will produce the Output

plot.png

The part of your question concerning randomizing your data has been answered before in this question.

m_goldberg
  • 107,779
  • 16
  • 103
  • 257
2

It is not clearly explained in your post, what should be the result. I can only guess, that you would like to get the function (the one you posted) modified by some noise.

Here the function noisedSignal[] is introduced. Check Menu/Help/tutorial/DefiningFunctions. It contains your signal modified by the noise. The latter is represented by RandomReal. Check Menu/Help/RandomReal to get more information. noisedSignal makes a table out of your function. Its terms have the form {t, signal}. It depends upon the variables a, the limit of the noise amplitude, and delta - the interval between the time values in the table. Check Menu/Help/Table. Evaluate this:

  noisedSignal[a_, \[Delta]_] :=
      Table[{t, 
        Sin[2 Pi t]*(1 + (1/5) Sin[6 Pi t] + (1/10) Sin[8 Pi t]) + 
         RandomReal[{-a, a}]}, {t, -5, 5, \[Delta]}];

Evaluate also the following and play with the parameter a by moving the slider:
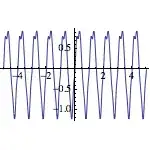
Manipulate[
 ListPlot[noisedSignal[a, 0.001], 
  AxesLabel -> {Style["t", 14, Italic], Style["Signal", 14]}], {a, 
  0.1, 1}]

Have fun.

Alexei Boulbitch
  • 39,397
  • 2
  • 47
  • 96
  • The RandomReal[{-a, a}] portion can of course be changed, if one wants noise that is not uniformly distributed. If one wants, say, Gaussian noise, what's needed is something like RandomVariate[NormalDistribution[0, 1]], or replace the 0 and 1 there with the desired mean and standard deviation, respectively. – J. M.'s missing motivation Jun 05 '13 at 07:42