Suppose that a complex valued function f[z]=f[x+i y]=u[x,y]+i v[x,y].
I want to plot3d its real part by coloring it with respect to its imaginary part.
For instance, if m and M are the smallest and greatest values of the imaginary part,
I want to color the graphic from white to black depending on the value of the
imaginary part (m is white, M is black).
I would be very glad if you can help me.
Asked
Active
Viewed 1,998 times
4
bkarpuz
- 809
- 5
- 16
-
2Related: 1), 2). – Michael E2 Jun 06 '13 at 22:53
2 Answers
3
Since you didn't mention what functions you want to plot, here are some simple ones:
 v[x_, y_] := Cos[x y];
 w[x_, y_] := x y;
 Plot3D[v[x, y], {x, 0, 1}, {y, 0, 1}, ColorFunction -> Function[{x, y, z}, w[x, y]]]
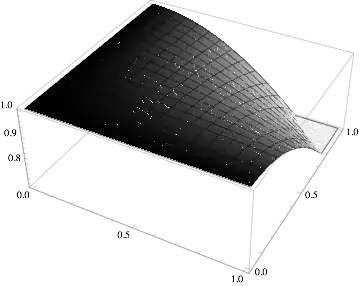
This works by choosing the ColorFunction to be the function w while the surface is v[x,y], so your original complex-valued function is f[x,y]:=v[x,y]+I w[x,y]. As 0x4A4D points out, there are many ways to proceed: many options for ColorFunctions and many ways to scale these using ColorFunctionScaling to fine tune the appearance of the plot.
bill s
- 68,936
- 4
- 101
- 191
-
The option
ColorFunctionScalingmight be interesting for the OP... – J. M.'s missing motivation Jun 06 '13 at 12:14
2
Yet another possibility would be to generate a density plot of the imaginary part, and use the resulting plot as a texture for the surface plot of the real part. Here's a demonstration, using $\log(z)$:
tex = Image[DensityPlot[Im[Log[x + I y]], {x, -3, 3}, {y, -3, 3},
                        AspectRatio -> Automatic, ColorFunction -> (GrayLevel[1 - #] &),
                        Frame -> False, ImagePadding -> None, PlotPoints -> 45,
                        PlotRange -> All, PlotRangePadding -> None],
            ImageResolution -> 144];

Plot3D[Re[Log[x + I y]], {x, -3, 3}, {y, -3, 3},
       BoundaryStyle -> None, Lighting -> "Neutral", Mesh -> None,
       PlotPoints -> 45, PlotStyle -> Texture[tex]]

A nice alternative you might want to consider is ColorFunction -> ColorData[{"GrayTones", "Reverse"}].
J. M.'s missing motivation
- 124,525
- 11
- 401
- 574