I am trying to plot a parametric circle in rainbow colors. It should go round once, but I'd like to be able to make it go round the rainbow an arbitrary amount of times.
I currently have:
ParametricPlot3D[{Sin[u] Sin[Theta], Cos[u] Sin[Theta],
  Cos[Theta]} /. Theta -> Pi/6, {u, -Pi, Pi},
  PlotStyle -> Directive[Thickness[.01]],
  ColorFunction -> Function[{x, y, z}, ColorData["Rainbow"][(Arg[x + I y] + Pi)/(2 Pi)]]]
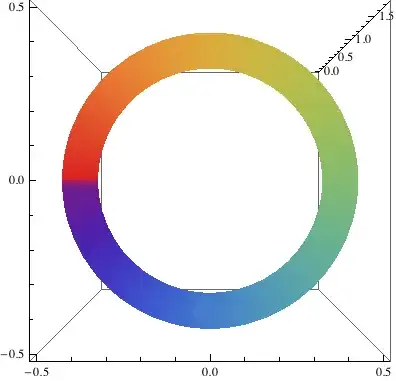
Which I think should choose a color from the ColorData named Rainbow (which changes only between 0 and 1 (the result of Arg lies between -Pi and Pi, so adding Pi and dividing the resulting interval by 2 Pi will give me a number between 0 and 1) depending on the angle of the circle. I get an almost decent result if I divide by Pi/2 instead of 2 Pi:
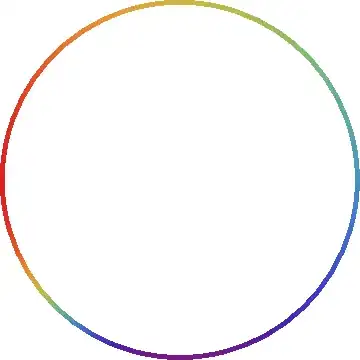
But I have no idea why there is yellow and green twice. I'm certainly missing something, does anyone know what?

ColorFunctionScaling. – J. M.'s missing motivation Jun 13 '13 at 13:23ColorFunctionScaling->False"fixes" it. But why would it being set to True mess up my own scaled values? – rubenvb Jun 13 '13 at 13:37ColorFunctionScaling -> True, thexandyare scaled even before being fed to your color function; that's different from scalingArg[], the output. – J. M.'s missing motivation Jun 13 '13 at 13:42