5

Here are the differential equations that set's up the 11 coupled oscillators.

new = Join[
Table[x[i]''[t] == - x[i][t] + 
 0.1*(x[i + 1][t] - 2*x[i][t] + x[i - 1][t]), {i, 1, 
9}], {x[0]''[t] == -x[0][t], x[10]''[t] == x[9][t], x[0][0] == 1, 
x[0]'[0] == 1, x[1]'[0] == 0, x[1][0] == 0}, 
Table[x[i][0] == 0, {i, 2, 10}], Table[x[i]'[0] == 0, {i, 2, 10}]]

Here are the solutions.

Solt = NDSolve[new, Table[x[i], {i, 0, 10}], {t, 25}]

Here are the individual plots.

Table[Plot[Evaluate[x[i][t] /. Solt], {t, 0, 25}, 
PlotRange -> All], {i, 0, 10}]

I am trying to figure out how to make a graph so along the x-axis are my i's from 0 to 10, and I can watch the wave move along each oscillator as time moves on. I keep getting errors in which it floods my notebook and doesn't stop unless I close the kernel.

This is what I have so far, and I'm not sure how to incorporate time into this.

Plot[Evaluate[x[i][t] /. Solt], {i, 0, 10}]

EDIT Coupled in a circle

Stew = Join[
 Table[x[i]''[t] == - x[i][t] + 
  0.1*(x[i + 1][t] - 2*x[i][t] + x[i - 1][t]), {i, 1, 
 9}], {x[10]''[t] == - x[10][t] + 
  0.1*(x[0][t] - 2*x[10][t] + x[9][t]), 
x[0]''[t] == - x[0][t] + 
  0.1*(x[1][t] - 2*x[0][t] + x[10][t])}, {x[0][0] == 0, 
x[0]'[0] == 0, x[1][0] == 1, x[1]'[0] == 0.5}, 
Table[x[i][0] == 0, {i, 2, 10}], Table[x[i]'[0] == 0, {i, 2, 10}]];

The Dsolve

Loin = NDSolve[Stew, Table[x[i], {i, 0, 10}], {t, 6.28}]

The individual graphs

Table[Plot[Evaluate[x[i][t] /. Loin], {t, 0, 6.28}, 
PlotRange -> All], {i, 0, 10}]

How would I go about putting the i=0 to 10 around in a circle?

J. M.'s missing motivation
  • 124,525
  • 11
  • 401
  • 574
Slightly
  • 321
  • 1
  • 2
  • 10

2 Answers2

8

After edit

I think oscillation directions should be parallel.

g[t_] = Table[{Cos[i*2 Pi/11], Sin[i*2 Pi/11], x[i][t]} /. Loin[[1]], {i, 0, 10}]; 

Animate[
 Show[
  ListPointPlot3D[g[t], PlotRange -> 1.5, BoxRatios -> 1, Filling -> Axis,
            PlotStyle -> Directive@AbsolutePointSize@7, Boxed -> False],
  ParametricPlot3D[{Cos@t, Sin@t, 0}, {t, 0, 2 Pi}, PlotStyle -> {Dashed, Black}]
  ,
  ImageSize -> 500, ViewVector -> {{Cos[t/15], Sin[t/15], 1} 11, {0, 0, 0}}, 
  AxesOrigin -> {0, 0, 0}, Ticks -> None, Axes -> True, AxesStyle -> {Red, Green, Blue},
  SphericalRegion -> True],
  {t, 0, 50}]

enter image description here

Before edit

f[t_] = Table[{i, x[i][t]} /. Solt[[1]], {i, 0, 10}];

Animate[ 
 ListPlot[f[t], PlotRange -> {{0, 11}, {-1.5, 1.5}}, 
  Joined -> True, PlotMarkers -> Automatic]
 , {t, 0, 25}
 ]

Good to notice: In f[t] definition := is intentionally replaced by =.

enter image description here

Kuba
  • 136,707
  • 13
  • 279
  • 740
  • wow that's fantastic!!!! – Slightly Jun 13 '13 at 21:21
  • I may be making another question where I couple the last point to the first point. I would then want to make the same type if thing, but take the i's and put them around in a circle. so that the 10 is equal to the 0. I already have all the individual plots of this, I would just need some guidance to how to put them in a circle instead of a line. – Slightly Jun 13 '13 at 21:22
  • @James Edit this question. Put new code and questions here. I think there is no need to make another. May be You could also analyze this solution and answer Your own question. Tip: 
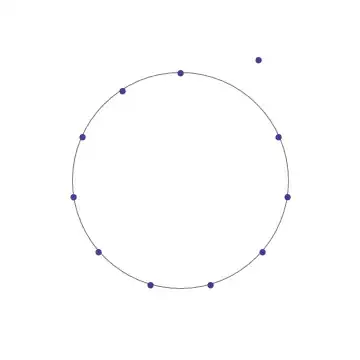
Table[{Cos[i*2Pi/11],Sin[i*2Pi/11],x[i][t]},{i,0,10}] – Kuba Jun 13 '13 at 21:30
  • Hmm. let me see if I can come up with something – Slightly Jun 13 '13 at 21:38
  • Would I have to use a parametric plot? – Slightly Jun 13 '13 at 21:45
  • @James ListPointPlot3D or Graphics3D also will be good. Of course arguments for each method should look slightly different. – Kuba Jun 13 '13 at 21:48
  • My computer keeps freezing when I try the 3d plotting.

    Thanks for the help.

    – Slightly Jun 13 '13 at 22:00
  • I Got this...I don't know what to put for the i's. I need 3 parameters? Animate[pts = Table[{Cos[i*2 Pi/11], Sin[i*2 Pi/11], x[i][t]}, {i, 0, 10, 10}]; ListPointPlot3D[pts, PlotRange -> {{- 6, 6}, {- 6, 6}, {-2, 2}}], {t, 0, 6.28}, AnimationRate -> 3, AnimationRepetitions -> 1] – Slightly Jun 13 '13 at 22:08
  • , How would you stop the axis from rotating? – Slightly Jun 16 '13 at 14:16
  • @James VectorView is t-dependent: ViewVector -> {{Cos[t/15], Sin[t/15], 1} just set it to {1,1,1} or delete it. – Kuba Jun 16 '13 at 14:19
  • I did that before I asked you, and it didn't work. Then I tried it again after you told me to, and it worked. Thanks! – Slightly Jun 17 '13 at 12:43
5

Solution by @Kuba can be easily extended to put the oscillators on a circle.

Loin = NDSolve[Stew, Table[x[i], {i, 0, 10}], {t, 50}];

fr[t_] = Transpose@{Most@Range[0, 2 Pi, 2 Pi/11], x[#][t]&/@Range[0, 10]} /. First@Loin;

r0 = 3;
Animate[
   ListPlot[
      Function[{th, r}, {(r0 + r) Cos[th], (r0 + r) Sin[th]}] @@@ fr[t], 
      PlotRange -> {{-5, 5}, {-5, 5}}, AspectRatio -> 1, 
      Prolog -> {Gray, Circle[{0, 0}, 3]}, Axes -> False, 
      PlotMarkers -> Automatic], 
  {t, 0, 50}]

enter image description here

mmal
  • 3,508
  • 2
  • 18
  • 38