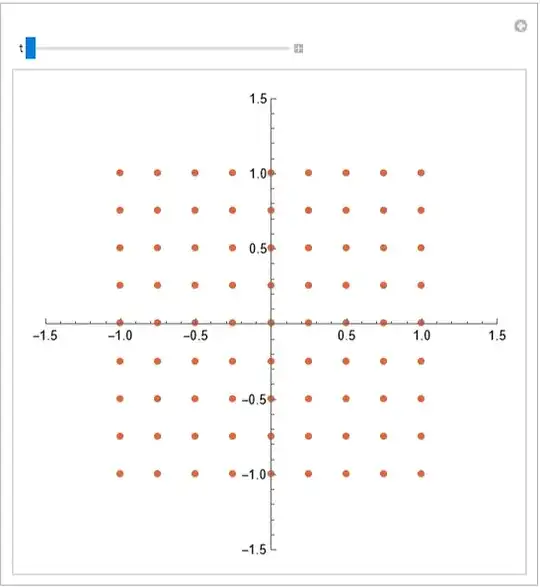
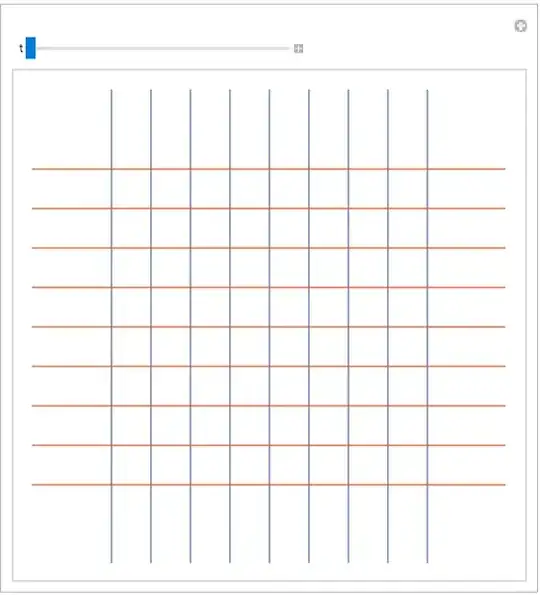
One can visualize linear transformation $P$ by animating action of $P^k$ for k between 0 and 1. Below is an attempt that does this with points. Ideally I would also like to visualize effect on the gridlines, what's an elegant way of doing this?

sqrtP = {{(2 Sqrt[29/3])/3, -(4/Sqrt[87])}, {0, 10/Sqrt[87]}};
animTrajectory[xs0_, A_] := Module[{},
   step = 0.025;
   xs = Table[
     Transpose[MatrixPower[A, k] . Transpose[xs0]], {k, 0, 1, step}];
   drawTrajectory[s_] := Graphics[{Opacity[.1], Point[xs[[;; s]]]}];
   drawTrajectories[s_] :=
    Graphics[{Opacity[.1]}~
      Join~(Line /@ Transpose[xs][[All, ;; s, All]])];
   combinedTrajectoryPlot[s_] := Show[
     ListPlot[xs0, PlotStyle -> Thick],
     ListPlot[xs[[s]], PlotStyle -> Red], drawTrajectories[s],
     PlotRange -> {{-1.3, 1.3}, {-1.3, 1.3}}, AspectRatio -> 1,
     GridLines -> Automatic,
     PlotLabel ->
      StringForm[
       "coordinate transformation \!\(\*SuperscriptBox[\(``\), \
\(``\)]\)", MatrixForm[sqrtP], NumberForm[N[s*step], {3, 2}]]];
   plots = Table[combinedTrajectoryPlot[s], {s, 1, Length[xs]}];
   ListAnimate[plots]
   ];
gridPoints = Table[{x, y}, {x, -1, 1, .25}, {y, -1, 1, .25}];
gridPoints = Flatten[gridPoints, 1];
animTrajectory[gridPoints, sqrtP]