Here's a quite natural way built into Manipulate and LocatorPane. Use the two arguments
...{-2., 0.}, {2., 0.},...
below to set the domain for the Locators. This lets the x coordinate range from -2 to 2 and the y coordinate range from 0 to, well, 0 -- that is, it can't move vertically.
Manipulate[
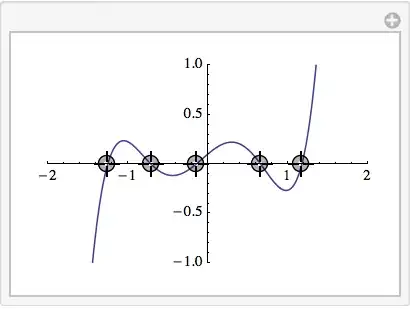
Plot[Evaluate[Times @@ (x - First /@ points)], {x, -2, 2},
PlotRange -> {{-2, 2}, {-1, 1}}],
{{points, ({#, 0} &) /@ RandomReal[{-2, 2}, {5}]}, {-2., 0.}, {2., 0.}, Locator}]
Here's another way. Use a LocatorPane and the second argument to Dynamic to set all of the second coordinates to 0. Here I have put a little grid above the Locator graphic to show the x, y coordinates. Of course the grid could be anything. So this example shows how to integrate ths sort of Locator control into Manipulate.
Manipulate[
 Column[{
   Dynamic @ Grid @ Transpose @ points,
   LocatorPane[Dynamic[points, (points = {#, 0} & /@ First /@ #) &],
    Graphics[{}, PlotRange -> {{-2, 2}, {-.1, .1}}, Axes -> True,
     ImageSize -> 300, Ticks -> {Automatic, None}]
    ]
   }],
 {{points, ({#, 0} &) /@ RandomReal[{-2, 2}, {5}]}, ControlType -> None}]

Edit:
Here's a variation on the preceding Manipulate in which the Locator control appears in the control area. This is perhaps a more natural way to incorporate a "multi-slider."
Manipulate[
 Column[{
   Dynamic @ Grid @ Map[Pane[#, {60, 12}] &, Transpose@points, {2}]
   }],
 {{points, ({#, 0} &) /@ Round[RandomReal[{-2, 2}, {5}], .001]},
   LocatorPane[Dynamic[points, (points = {#, 0} & /@ First /@ #) &],
     Graphics[{}, PlotRange -> {{-2, 2}, {-.1, .1}}, Axes -> True,
       ImageSize -> 300, Ticks -> {Automatic, None}],
     Appearance -> Graphics[{EdgeForm[Gray], LightGray, Disk[]}, ImageSize -> 10]
     ] &}
 ]
